April 17, 2006
How much do those red and blue jellybeans predict about linguistic ability?
Narly Golestani, Nicolas Molko, Stanislas Dehaene, Denis LeBihan and Christophe Pallier ("Brain Structure Predicts the Learning of Foreign Speech Sounds", Cerebral Cortex, published online April 7, 2006) trained 65 native speakers of French to distinguish Hindi dental vs. retroflex consonants. Then they MRI-scanned the brains of the 11 fastest and 10 slowest learners, and concluded that
... left auditory cortex WM [white matter] anatomy ... partly predicts individual differences in an aspect of language learning that relies on rapid temporal processing ... [and] a global displacement of components of a right hemispheric language network ... is predictive of speech sound learning.
Ben Zimmer posted on Language Log on 4/7/2006 about the use of the word linguist in the headline of the BBC's report on this work: "Linguists 'have different brains'". It's amusing to note that at some point between then and now, the BBC changed the headline to read "Polyglots 'have different brains'". Anyhow, the BBC story ends with a striking quote from Dr. Golestani:
"We can start to make predictions regarding whether people will be good at something or not based on their brain structure," she said," or diagnose clinical problems."
This is immediately followed by a very pretty pair of brain images that reinforce her point impressively:
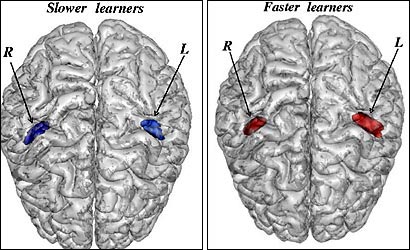
As Baruch Grazer at Deep Weeds put it,
Apparently, linguists have a pair of red jelly beans in their brains. Non-linguists are, sadly, forced to muddle along with a blue jelly bean pair.
Now, Dr. Golestani's forecast of a modern phrenology will doubtless come true to some extent, though there is plenty of room for controversy about how far we'll be able to go in predicting performance from local features of gross neuroanatomy. But the juxtaposed picture may, I think, have given many readers a misleading idea of how accurately the jellybeans in your brain can now be used to characterize your talents.
One of the issues emerges in this quote from the Golestani et al. paper:
In order to better characterize the VBM ["voxel-based morphometry"] result in HG [Heschl's Gyrus], we manually labeled (segmented) the left and right HG of the 21 subjects on anatomically normalized images using previously defined criteria (Penhune and others 1996). In cases where there were multiple transverse gyri, or when there was a single gyrus divided by a sulcus intermedius (SI) that extended to at least half of the length of HG, we included only the most anterior gyrus or gyral subregion, respectively, regions most likely to encompass the primary auditory cortex (Rademacher and others 2001). The rater was blind to group (faster vs. slower) and hemisphere, and the labeling was performed twice. HG volumes were significantly correlated across labelizations (left: r = 0.81, P < 0.001, P < 0.001, right: r = 0.78), providing evidence for labelization reliability. We found that the left but not the right HG is larger in faster compared with slower learners ... [emphasis added]
Since Heschl's Gyrus is primary auditory cortex, it's plausible that people with radically different abilities to learn new phonological distinctions might show an anatomical difference there. But what, you may ask, is this "labelization reliability" business?
Well, different people's brains are at least as different as their faces are, not just in size but also in shape. If we want to compare the size or shape of my nose and your nose, we need to define what we mean by "nose" and how we're going to measure its size and shape. We'd also want to know how reproducible the data from different nose-measurers is; and we'd want to be sure that the nose-measurers did not have any particular expectations about what they should find in a given case. This is not an entirely fanciful example -- as Darwin explains in his autobiography, the dimensions of his nose nearly cost him his position as naturalist on the voyage of the Beagle:
Next day I started for Cambridge to see Henslow, and thence to London to see [Captain] Fitz-Roy, and all was soon arranged. Afterwards, on becoming very intimate with Fitz-Roy, I heard that I had run a very narrow risk of being rejected, on account of the shape of my nose! He was an ardent disciple of Lavater, and was convinced that he could judge of a man's character by the outline of his features; and he doubted whether any one with my nose could possess sufficient energy and determination for the voyage. But I think he was afterwards well satisfied that my nose had spoken falsely.
If we want to compare the size of your Heschl's Gyri and my Heschl's Gyri, the same requirements apply; and Golestani et al. have clearly met them. They used "previously defined criteria" for morphological segmentation of MRI images; they had each brain segmented twice by different raters, who were not told whether they were looking at the brain of a fast or slow (retroflexion) learner, or at the right or left cerebral hemisphere.This is all excellent practice, as would be expected from such eminent researchers.
The striking thing, though, is that the results for the different raters have rather modest degrees of correlation: r=0.81 in the right hemisphere, and r=0.78 in the left hemisphere. What does this really mean? Well, one way to look at it is that the square of these numbers (r2=0.66 in the right hemisphere and r2=0.61 in the left hemisphere) tells us how much of the variation in measured volume was caused by the identity of the brain being measure: 61-66% of the measured variation was due to the actual anatomy of the brain being measured, while 34-39% was noise due to measurement error (or really, measurement uncertainty). This is not a great start to the project of predicting ability from the size of brain regions: almost 40% of the measured variation is noise, even before we look at abilities at all.
To give you an idea of how much measurement uncertainty a correlation of r=0.78 represents, that's exactly the correlation between the (hypothetical) measurements of body weight (in pounds) for ten people given by two different scales in the table below:
| Person 1 | Person 2 | Person 3 | Person 4 | Person 5 | Person 6 | Person 7 | Person 8 | Person 9 | Person 10 | |
| Scale 1 | 130 |
112 |
140 |
160 |
182 |
175 |
195 |
197 |
210 |
209 |
| Scale 2 | 100 |
135 |
123 |
181 |
190 |
166 |
170 |
228 |
167 |
250 |
Although the mean values for the two scales are the same, and the correlation between their results is highly significant, the reported weights are different enough that you'd wonder if the scales might be defective, or if the research assistants reading them might not have been paying attention. That would be the wrong conclusion about the Golestani et al. gyrus-size estimates: I'm sure that the brain-anatomy raters were highly skilled and did an excellent job in applying the criteria they were given. The thing is, though, this sort of segmentation of brain anatomy is apparently not now a task that different experts can agree on to a very exact degree.
[Another way to look at these numbers is to compare them to the test-retest correlations for the SAT, which are said to be between 0.86 and 0.9 (Donlon 1984), or the test-retest correlations for the Stanford Binet, which are reported as between 0.85 and 0.95 (Thorndike and Hagen 1977). The correlation of AES ("automated essay scoring") systems with the scores of human raters is reported to be "generally between .70 and .90 and often between .80 and .85". ]
In the published paper, Golestani et al. give a scatter plot of the HG sizes -- overall volume, and volume of grey matter (neuronal cell bodies, "GM") and white matter (neuronal interconnections, "WM"). As you can see, the distributions overlap pretty extensively even in the case (left hemisphere white matter) where there is a statistically significant difference in means:
In fact, the result that I found most interesting was not the reported quantitative difference, but rather a qualitative difference, a difference in shape:
Finally, we explored group differences in the gross morphology of LHG by examining the frequency of duplication or splitting of HG in the left hemisphere in slower and faster learners. We found that in the group of faster learners, 6/11 individuals had either a duplicate or a split LHG, whereas in the group of slower learners, only 1/10 individuals had duplicate or split LHG.
We aren't told how often the raters agreed on whether the gyrus was duplicated or split, but I'd assume that this is somewhat more intersubjectively stable than the volume estimates.
Given the emphasis on prediction of learning performance, there's a table that I would have liked to see in the paper: nine columns for each of the 21 imaged subjects, one giving the quantitative performance on the phonetic learning task, and eight giving the right and left HG grey and white matter volume estimates from the two raters. This would give us a genuine basis for seeing how accurately learning can now be predicted from (this aspect of) anatomy. A complete table of all the relevant features for the 11 subjects would be even better, enabling us to use cross-validation techniques to estimate the likely performance of various prediction models on new subjects. Certainly any researcher in the machine learning area would (I think) want to look at the problem that way.
We could also start to compare the predictive power of neuroanatomical measurements with the traditional way to "make predictions regarding whether people will be good at something or not", namely aptitude tests.
. Posted by Mark Liberman at April 17, 2006 12:20 AM