September 26, 2007
The "happiness gap" and the rhetoric of statistics
More precisely, I'm talking about the rhetorical translation of statistical results into journalistic generalizations.
In today's NYT, David Leonhardt ("He's Happier, She's Less So") tells us that in a recent survey, men and women "often gave similar answers about what they liked to do". However, "there were also a number of activities that produced very different reactions from the two sexes" -- for example, men said that they found being with their parents unpleasant only 7% of the time, while women found it unpleasant 27% of the time.
But that's just the teaser. According to Leonhardt,
This intriguing -- if unsettling -- finding is part of a larger story: there appears to be a growing happiness gap between men and women.
Two new research papers, using very different methods, have both come to this conclusion.
The way he tells us about this "growing happiness gap" is a lovely example of scientific research as moral fable. And his story is also an especially clear case of a key method in this transformation: turning small differences in group distributions into categorical statements about group properties.
Here's the first piece of research, as Leonhardt summarizes it:
Betsey Stevenson and Justin Wolfers, economists at the University of Pennsylvania (and a couple), have looked at the traditional happiness data, in which people are simply asked how satisfied they are with their overall lives. In the early 1970s, women reported being slightly happier than men. Today, the two have switched places.
Stevenson and Wolfers report their results in a paper, available as a preprint on their web site, titled "The Paradox of Declining Female Happiness". Here's Figure 1 from their paper, presenting data from the General Social Survey:
It's not obvious, by the method of ocular trauma ("what strikes the eye"), that the sex differences in this data are anything but random noise. But the authors' "ordered probit regression analyses" produces "implied estimates of the gender happiness gap" which allow them to assert that "At the start of the sample women reported higher levels of subjective well-being than did men, however by 2006 this earlier gap had reversed and women's subjective well-being in recent years is lower than that of men".
I'm not about to argue with an ordered probit -- the penalty for that is 15 to 30 months in the slammer, as I recall. (And I'm in the middle of teaching Generalized Linear Models at the moment, so it would be hypocritical of me to bad-mouth one of them.) But in fact, as their Table 1 indicates, the ordered probit analysis found that the "Gender happiness gap" was not statistically significant, either in 1972 or in 2006, even at the 0.10 level. The significant effect was the "Difference in Time Trends".
My point is that these effects, whatever they are, are quite small, requiring clever statistical analysis over very large amounts to data to be seen at all. The researchers themselves describe their inferred distributions this way:
Comparing the 2006 medians with the distribution for men in 1972, we see that the median woman in 2006 is as happy as a man at the 48.8th percentile in 1972 [...], while the median man in 2006 is as happy as the man at the 50.7th percentile in 1972.
1.9 percentile points is not much of a gap, if you ask me. I'd call it more of a crack, or maybe just a a wide pencil line.
The Stevenson and Wolfers paper looks at some other data, and has many interesting things to say -- the main message is expressed in their abstract this way:
By most objective measures the lives of women in the United States have improved over the past 35 years, yet we show that measures of subjective well-being indicate that women's happiness has declined both absolutely and relative to male happiness. [...] Our findings raise provocative questions about the contribution of the women's movement to women's welfare and about the legitimacy of using subjective well-being to assess broad social changes.
But I'd like to pause at this point to consider the rhetorical effect of the report of these results in the New York Times. Leonhardt's article came up in a couple of conversations that I was involved in today. In each case I showed Figure 1 (above). People found it puzzlingly inconsistent with the message that they had taken away from their encounter with with the newspaper.
Most people think in essentialist and non-statistical terms, as if all the members of a category were uniform copies of an invariant prototype. I suspect that most journalists think this way too, but in any case, they certainly write as if they do .
Here, we start with a study that found *no* statistically significant difference in male vs. female group happiness at either end of a time series, even though the data came from a large survey, whose size of 1,500 respondents in 1972 rose to 4,500 respondents by 2006. Looking across all 34 years, the resesarchers were able to find a statistically significant difference in overall male vs. female trends. The magnitude of this effect was cumulatively quite small (though doubtless important from the perspective of the philosophy of economics).
But what people take away from the journalistic description of this study is that women used to be happier than men, and now men are happier than women -- and they think of this as a fact about all men and all women. In fact, we're talking about effects whose size is such that perhaps the happiest half of the population, on an optimistic reading of a complex statistical reconstruction, contains a couple of percent more of one sex than the other! When I show readers of the NYT article the graph of the data that underlies this study, they're flabbergasted.
OK, how about that other study? We're told that it's "even starker":
Mr. Krueger, analyzing time-use studies over the last four decades, has found an even starker pattern. Since the 1960s, men have gradually cut back on activities they find unpleasant. They now work less and relax more.
Over the same span, women have replaced housework with paid work -- and, as a result, are spending almost as much time doing things they don't enjoy as in the past. Forty years ago, a typical woman spent about 23 hours a week in an activity considered unpleasant, or 40 more minutes than a typical man. Today, with men working less, the gap is 90 minutes.
Unfortunately, the paper with the details "will be published in the Brookings Papers on Economic Activity", and I haven't been able to find a preprint. So we'll have to imagine what we'll find when the paper is out, and instead of being told about "a typical woman", we can look in detail at the distribution by sex of time spent per week in activities "considered unpleasant", and how those distributions have changed over the past 40 years.
I can tell you what I expect.
The statement in Leonhardt's NYT article, which we can bet is chosen from the available numbers to make the point as "starkly" as possible, means that over a period of 40 years, women's average self-report of participation in unpleasant activities has increased by about 12 minutes per day relative to men's. This is about 3.6% of the average time reported for such activities. The cited gap of 90 minutes a week between women and men is about 6.5% of the overall average.
I don't know what the standard deviations of these reported unpleasant-activity times are, but we can guesstimate them based on Krueger, Alan B. and David Schkade. "The Reliability of Subjective Well-Being Measures", January 2007, which analyzed
the test-retest reliability of two measures of subjective well-being: a standard life satisfaction question and affective experience measures derived from the Day Reconstruction Method (DRM).
What they found was that people were pretty inconsistent in reporting their affective state:
We analyzed the persistence of various subjective well-being questions over a two-week period. We found that both overall life satisfaction measures and affective experience measures derived from the DRM exhibited test-retest correlations in the range of .50-.70. While these figures are lower than the reliability ratios typically found for education, income and many other common micro economic variables, they are probably sufficiently high to support much of the research that is currently being undertaken on subjective well-being, particularly in cases where group means are being compared (e.g. rich vs poor, employed vs unemployed) and the benefits of statistical aggregation apply.
With test-retest correlations of 0.6 or so, we'd expect multiple tests of the same individual to show a large variance for "time spent per week in activities considered unpleasant", and for group (i.e. male or female) variances to be even larger. It wouldn't be surprising, I think, to learn that the pooled standard deviation of "time spent per week in activities considered unpleasant" is something like 50% of the mean, or around 11.5 of the 23 average unpleasant hours. If so, then the effect size of the cited 90-minute gap might be something like 1.5/11.5 = 0.13.
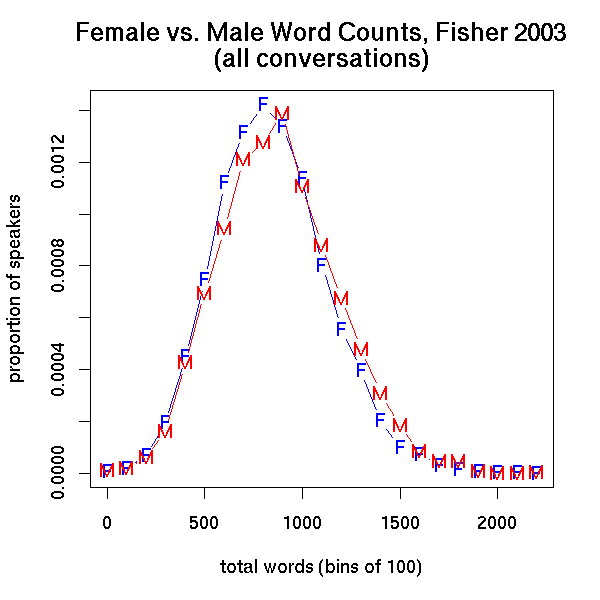
If you're not familiar with the concept of "effect size", you can read about it here -- an old Language Log post where it turned out that the effect size of the difference in talkativeness between males and females, measured in words per conversational side, was 0.128, which corresponds to a pair of word-count distributions that looked like this:
Again, readers of the New York Times article take away the impression that each woman is spending an hour and a half more per week in "activities considered unpleasant" than each man is. But whatever the real "happiness gap" in this study turns out to be, it's likely that the between-group effect size was very small. And one way to quantify this is to ask how what the odds are that a randomly selected woman reports more time per week spent in unpleasant activities than a randomly selected man does. If the between-group effect size is really as small as 0.13, then the random woman will log more misery-time than the random man about 54 times out of 100. This is a difference in the same general range as we saw in the first study.
[I apologize for the crudely hypothetical analysis of this research -- but I'm not the one who generated a widely-discussed NYT article on a study's conclusions before publication of any of the details on which those conclusions are based.]
OK, so imagine coming into a door labeled "the room of unhappy people". You enter, and find yourself in a hall with between 51 and 54 women, and between 46 and 49 men. Do you think that you could decide which sex predominated, without lining everyone up and doing an explicit count?
Now imagine that you walk through two such rooms, where the first one is around 51-to-49 female, and the second is around 54-to-46 female. Do you think that you would notice the direction of difference in the sex ratios, without another pair of line-ups?
More to the point, do you think that you could spin differences like these into today's second-most-emailed NYT story?
If your answer is "yes", then you may have a future as a science writer. (Or, perhaps, as an economist...)
[To forestall objections from the well-informed readers who occasionally take me to task for treating survey answers as if they were unbiased indicators of people's true internal states and behavioral dispositions, let me stress that I'm just going along with the assumptions of the research under discussion. The group differences in these studies are small ones, whether they're really differences in overall emotional state and in affective reactions to life's experiences, or differences in the mapping from internal emotional states to ways of answering survey questions about feelings and in estimating percentages of time spent in various ways. Whatever they are, these small differences between group distributions have now been transformed, in the public's mind, into facts about all the individual group members.]
[Update -- more here.]
Posted by Mark Liberman at September 26, 2007 10:11 PM