October 20, 2007
Puzzle of the day: The constitution in B flat?
When David P. Currie read the U.S. Constitution out loud, did he perform it in the key of B flat, using melodies from a strange scale made up of minor thirds and tritones? Probably not, but read on.
Yesterday, I was at four interesting gatherings. There were memorials for Henry Hiz and Bob Lucid, where I learned interesting things about each of them, and even more interesting things about the people who gathered to talk about them. There was a meeting at the library where Laura Brown, author of the Ithaka report "University Publishing in a Digital Age", spoke about the future of scholarly communications.
And Greg Kochanski was here at Penn to give a talk on the topic "Maintaining information contours in the brain", which presented data from Bettina Braun, Greg Kochanski, Esther Gabe and Burt Rosner, "Evidence for attractors in English intonation" (preprint here).
The basic idea of Greg's talk was that people are able to imitate gradient values of pitch contours with reasonable accuracy, but when they copy their own productions recursively, their performances drift gradually towards patterns that you could think of as "attractors" in a sort of iterated map of imitation -- or perhaps as emergent psychological categories.
In conversation with him later in the afternoon, I mentioned a Language Log post from about a year ago, "Poem in the key of what" (10/9/2006), where I evaluated the idea that small-integer pitch ratios (that is, musical intervals) might play a role in the intonational contours of normal speech. I was skeptical of that idea, and still am, but I found it surprisingly hard to disprove it purely on the basis of comparing histograms of fundamental-frequency values in speaking as opposed to singing. We expect to see multiple modes in the histogram of singing pitches, correponding to the different pitch classes in the abstract musical scale implicit in the performance. But talking is not singing, and so it's suprising that (at least on phrase-by-phrase basis) we see similar modes in the histogram of speaking pitches.
That same post shows some data from an old paper, Mark Liberman and Janet Pierrehumbert, "Intonational invariance under changes in pitch range and length", pp. 157-233 in M. Aronoff and R. Oehrle, Eds., Language Sound Structure, MIT Press, 1984. Although that paper was basically about how the various parts of a pitch contour scale relative to one another as pitch range changes, the research in question actually began as an attempt to debunk an earlier claim of characteristic musical intervals in speech.
The idea was that if there really are favored pitch classes or pitch intervals in speech, then if you put speakers in a situation that encourages them to show you a wide range of pitch ranges, the resulting distributions of pitch values and pitch relationships should show some clumping around the favored values and/or intervals. Such probability enhancement in certain regions of the distribution might provide evidence about the structure of the underlying process, just as peaks in the graph of interaction cross-section vs. energy do in particle physics.
We didn't find any (multiple) peaks to explain -- which was exactly what I expected at the time -- but we did find some nifty patterns of other sorts. And since positive results are much more fun than negative ones, we didn't even discuss the failure to find what we were originally looking for, focusing instead on the scaling issues.
Therefore, I was somewhat surprised by the mutliple modes in the F0 histograms that I made last year. However, I persuaded myself that they mostly arose because of some not-especially-musical characteristics of the fairly short (sentence-sized) pitch contours that I got data from. In the longest passage I tested -- a Sylvia Plath poetry reading about three minutes long -- the histogram was considerable smoother. There were still some lumps, but, I told myself, it's poetry, after all.
I followed up a few days later ("More on pitch and time intervals in speech", 10/15/2006), with a post that looked at plots of dipole statistics as a way to examine pitch intervals in speech. That produced some pretty pictures and a certain amount of puzzlement. And what with one thing and another, I never really got back to it.
But it seems possible that there's a connection between the "attractors" that Braun, Kochanski et al. found, and those puzzling modes and ridges. So I promised Greg that I'd try looking at a longer sample, staying away from poetry. And so late last night, after I got back from the memorial for Bob Lucid, I downloaded David Currie's reading of the U.S. Constitution, available here from the University of Chicago Law School. It's about 50.14 minutes of audio in total. The pitch tracker that I used found 196,128 f0 values in voiced frames, out of 300,845 total analysis frames (at the conventional 100 frames per second), which corresponds to about 32 minutes and 41 seconds of voiced speech.
After converting the f0 values in Hz to semitones (relative to A 110), and dividing them into quarter-tone bins, here's the result:
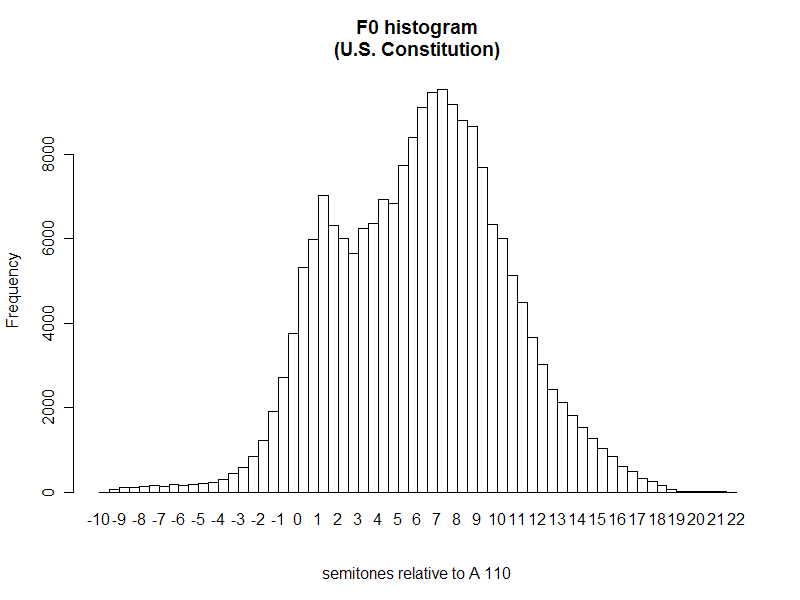
As you can see, there are clearly at least two modes about a tritone apart (and I think there's pretty clearly a third component about half-way in between them). Three-quarters of a diminished chord? or some strange mode including those pitch-classes? Or just an artefact of the structure of the document and the speaker's style?
The lower peak corresponds to a pitch of B flat, which is where I got the jocular title of this post. But I can think of a dozen obvious questions to ask about what's really going on here, and three or four plausible sources of artefact, so let's hold off before concluding that Ken Pike was right about English having four phonemic pitch levels. Or adding the speculation that these might correspond to the four pitch-classes of a scale dividing the octave into minor thirds, as I did in a moment of fatigue-induced unscientific weakness while writing my dissertation, many years ago.
Meanwhile, I've got to give a shout-out to computer technology and the internet. This little experiment took me a total of 20 minutes of elapsed time to perform. About half that time was waiting for the 70-MB mp3 file to download over a marginal wireless connection, and rebooting the elderly laptop on which I converted it from mp3 to wav, when the size of the resulting array caused some simultaneously-running applications to freeze up. For someone like me, who started looking at pitch tracks by tracing overtones on narrow-band (paper) spectrograms 40 years ago, that's amazing.
Posted by Mark Liberman at October 20, 2007 07:55 AM