October 04, 2005
Only 7% of variance shared across data from different web search engines?
Well, it's not really that bad. Except sometimes. Here's the story.
This starts with the most recent issue of Language, which has has several excellent articles that should appeal to interested non-specialists. I wish (again!) that Language were an Open Access journal, so that those of you without institutional subscriptions could read it. And meanwhile, it would be nice to have the table-of-contents info on the journal's web site kept up to date, with an accessible link to the subscribers-only content at Project Muse -- the TOC for the September issue, sent to the printers several months ago and delivered to subscribers several weeks ago, is still not displayed as of this morning.
But enough complaining. I'd like to point readers to one of those excellent articles: Anette Rosenbach, "Animacy versus Weight as Determinants of Grammatical Variation in English", Language 81(3) 613-644. It was this article that reminded me of a disappointing fact about (some of) the counts returned from web searches.
Dr. Rosenbach starts from a traditional observation: the choice between the English expressions of possession "X's Y" and "the Y of X" is influenced by the animacy and the (linguistic) weight of X. If X is weightier -- e.g. longer -- then "the Y of X" is more likely and "X's Y" is less likely. And if X is animate or human, "X's Y" is more likely and "the Y of X" less likely. Here's a table of Google counts exemplifying the effect of animacy in a single context:
| the child | the ocean | |
| the temperature of __ | 239 |
12,500 |
| the __'s temperature | 687 |
1,090 |
| apostrophe-s proportion | 74% |
8% |
And here's a related example showing the effect of length:
| the ocean | the Atlantic ocean | the North Atlantic ocean | |
| the temperature of __ | 12,500 |
145 |
57 |
| the __'s temperature | 1,090 |
8 |
1 |
| apostrophe-s proportion | 8% |
5% |
2% |
Dr. Rosenbach explores the interaction of these two factors (length and animacy) both in studies of reader judgments and in a corpus study, which uses the British component of the International Corpus of English (ICE-GB). Here's (a slightly revised form of ) one of her tables from the corpus study, showing the interaction of these two factors in determining apostrophe-s proportion, for possessors between 1 and 4 words long:
| L(possessor)=1 | L(possessor)=2 | L(possessor)=3 | L(possessor)=4 | |
| Human possessor | 387/482 (80%) | 370/491 (75%) | 56/94 (60%) | 1/15 (7%) |
| Inanimate possessor | 14/44 (32%) | 44/711 (6%) | 3/244 (1%) | 1/65 (1%) |
She argues, based on statistical modeling of such data, that the two effects can't be reduced to epiphenomenal projections of a single underlying effect, as some have suggested. The paper is full of interesting examples and discussions -- by all means go read it, if you can get access to a copy.
As I mentioned , Dr. Rosenbach's numbers don't come from web search counts, but rather from a parsed, balanced -- but small -- corpus, ICE-GB, comprising only a million words of text. There are lots of advantages to such a corpus, but its small size can be a big disadvantage. So I thought I'd explore what we can learn about the distribution of possessive structures in a corpus the size of the web at large. In particular, I wondered whether there might be effects of phonological weight (the number or type of syllables in a word), of word frequency, and so on. And I was also interested in the different distributions for different head words. So I started with a set of city names, which can be found in phrasal pairs like "the population of Miami" vs. "Miami's population", or "Chicago's architecture" vs. "the architecture of Chicago".
Here's a sample with counts from Google, ranked in order of increasing 's proportion:
| Los Angeles County | Vienna | New York | Tallahassee | San Antonio | London | Moscow | Miami | Cleveland | San Francisco | Hong Kong | Chicago | Denver | Austin | Baghdad | San Diego | |
| population of __ | 1,320 | 479 | 28,800 | 172 | 392 | 32,000 | 703 | 722 | 449 | 782 | 9,500 | 628 | 326 | 428 | 527 | 654 |
| __'s population | 441 | 161 | 10,800 | 80 | 257 | 22,100 | 654 | 684 | 461 | 837 | 11,300 | 838 | 443 | 641 | 869 | 122,000 |
| 's proportion | 25% | 25% | 27% | 32% | 40% | 41% | 48% | 49% | 51% | 52% | 54% | 57% | 58% | 60% | 62% | 99.5% |
There's a considerable range here, from 25% to 95.5%, which is what we want if there's going to be an effect to explain. However, the highest point (San Diego) looks like an outlier. Indeed there's something funny going on: nearly all of the 122,000 instances of "San Diego's population" are from a set of pages at sandiego.merchantamerica.com ("San Diego Directory of Merchants"). This seems to be a legitimate site, not some sort of fake search-engine-optimization link-infestation (though I wonder, can there really be 122,000 different businesses serving San Diego's 1.2M people?), but it's irrelevant to this investigation in any case.
A glance at the rest of the hits doesn't turn up any similar catastrophes, but neither is very much of the variation attributable to any obvious linguistic trend. That's not too discouraging, since the explanation might involve several factors and this is a small sample. But whatever the explanation, how much signal is there here?
One way to look into this question is to compare results from a different search engine. Here's the same table with counts from MSN search:
| Los Angeles County | Vienna | New York | Tallahassee | San Antonio | London | Moscow | Miami | Cleveland | San Francisco | Hong Kong | Chicago | Denver | Austin | Baghdad | San Diego | |
| population of __ | 1,280 | 630 | 11,887 | 79 | 594 | 9,939 | 1,161 | 1,428 | 952 | 3,339 | 2,774 | 2,801 | 602 | 665 | 1,666 | 1,481 |
| __'s population | 302 | 205 | 3,810 | 134 | 463 | 8,024 | 431 | 1,105 | 836 | 1,729 | 4,004 | 2,330 | 824 | 1,062 | 627 | 2,283 |
| proportion 's | 19% |
25% |
24% |
63% |
44% |
45% |
27% |
44% |
47% |
34% |
59% |
45% |
58% |
61% |
27% |
61% |
The range of apostrophe-s proportions in the MSN counts is somewhat smaller, only 19% to 63%, though that's just because MSN's San Diego apostrophe-s count is more reasonable -- throwing out San Diego, the Google proportions were 25% to 62%. However, the remaining variation doesn't correlate terribly well, as this scatter plot of the proportions calculated from the the two counts suggests.
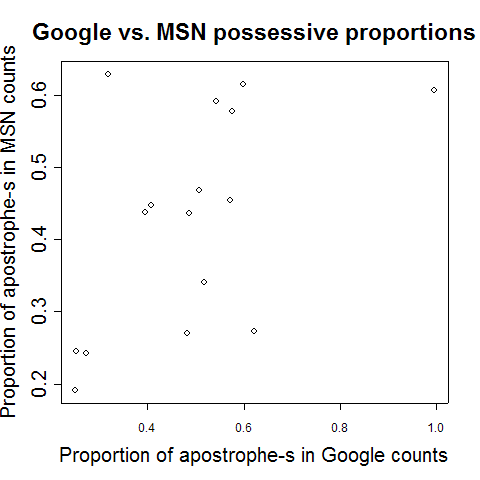
In fact, the r2 measure of correlation between the two sequences of numbers is only 0.27, meaning that only about 27% of the variance of the MSN ratios can be predicted from the Google ratios (and vice versa). And in fact, if we remove the (bogus) San Diego point, which happens by accident to be pulling the correlation up, r2 for the estimated proportions drops to 0.20, or 20 percent of variance accounted for.
In other words, about 4/5 of the variance in our estimates of possessive-construction proportions for different city names is apparently due to the selection procedures used by different web search systems. This leaves only about a fifth of the variation to be accounted for by any factors relating to the actual city identities, whether these factors are linguistic or extra-linguistic. The situation is is by no means hopeless -- there are a lot of city names out there, and so we might eventually be able to separate some gold from the dross. However, it's not going to be an easy task.
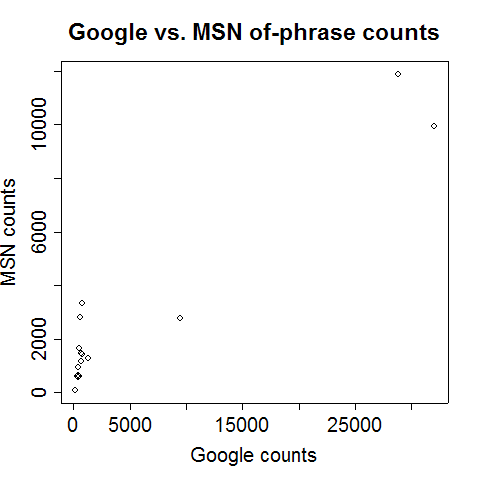
Not everything is quite so bleak: r2 for the of-phrase counts is 0.97:
although for the apostrophe-s counts, the bogus San Diego point reduces it to 0.07 (this is where I got the 7% figure for the title):
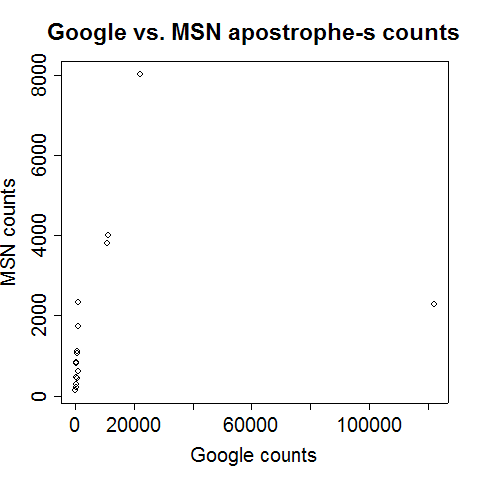
If we leave out the San Diego estimates, these numbers become 0.97 for the of-phrase counts and 0.93 for the apostrophe-s counts. However, most of this (excellent) degree of correlation is due to variation in population and overall web presence, rather than to any linguistic factors.
Moral: interpret web counts with caution! They're often informative, but they're by no means a direct route to linguistic truth. At a minimum, you should verify that effects are shared across two or three search engines.
This is not some special flaw in web counts as data. The raw material of science often requires a significant amount of refinement. As an object lesson from another field, I recommend a fascinating post from last August at RealClimate about the interpretation of radiosonde data with respect to upper-air temperature trends and global warming.
Google counts: no worse than tropospheric temperature data.
[ Update: for a scholarly discussion of the question "what do search engines really index, anyhow?", see a lovely series of posts by Jean Véronis at Technologies du Langage, dealing with the controversy that arose back in August over the relative size of Google and Yahoo's indices:
http://aixtal.blogspot.com/2005/08/yahoo-missing-pages-1.html
http://aixtal.blogspot.com/2005/08/yahoo-missing-pages-2.html
http://aixtal.blogspot.com/2005/08/yahoo-missing-pages-3.html
http://aixtal.blogspot.com/2005/08/yahoo-missing-pages-4.html
Jean also muses here on how it is that Google managed to index 584,000 pages on his personal website!
For what it's worth, Yahoo finds 41,000 hits for "San Diego's population", and indeed all but 312 of them seem to be from merchantamerica.com. Was this a case where MSN was smart enough to avoid a doubtful site that both Google and Yahoo fell for? Or did MSN just index a smaller sample, and so missed this cache by luck rather than by design? I have no idea; but linguists need to be careful, out there in the back streets of the web. ]
Posted by Mark Liberman at October 4, 2005 07:35 AM