June 26, 2007
IQ and birth order
For the past few days, the most highly-emailed study on the NYT web site has been Benedict Carey, "Study on I.Q. Prompts Debate on Family Dynamics", 6/25/2007, which reports on "new evidence tying birth order to IQ". (There's an earlier article by Carey, "Research Finds Firstborns Gain the Higher I.Q.", 6/22/2007.) I'm glad to say that the NYT story offers a link to the original study, which is Petter Kristensen and Tor Bjerkedal, "Explaining the Relation Between Birth Order and Intelligence", Science 316(5832) 1717, 22 June 2007. The same issue of Science also has a "Perspectives" piece by Frank Sulloway, "Birth Order and Intelligence". (Not that those links will be much help to those who don't have subscriptions.)
The NYT blogs area also has a lively discussion in which Frank answers readers' questions -- though this topic didn't generate as much interaction as discussions of linguistics do, it's still clearly something that people are very interested in.
Anyhow, last night Mark Seidenberg wrote to ask
I'm not sure what the language link is, but given the amount of statistics you've been gently teaching people via the blog, and your continuing focus on the credulity of the mass media when it comes to reporting science (not to mention the credulity of "Science" the magazine), are you considering doing a post on the iq and birth order story?
Is a 3 point difference in IQ that is statistically significant in a large scale study of this sort also functionally significant? Did someone really say this might represent the difference between getting a B or an A in a class? which class was that? math, history, art? Does anyone remember what has been learned about what IQ tests do and do not measure?
Well, Frank Sulloway's Perspectives piece does give a somewhat artificial argument about admissions to some highly hypothetical colleges:
Critics might still argue that the mean IQ difference documented between a Norwegian firstborn and a secondborn is only 2.3 points. Such a modest difference, however, can have far greater consequences than most people realize. For example, if Norway's educational system had only two colleges--a more prestigious institution for students with IQs above the mean, and a less desirable institution for all other students--an eldest child would be about 13% more likely than a secondborn to be admitted to the better institution (the relative risk ratio), and the odds of a firstborn being admitted would be 1.3 times as great.
And Benedict Carey's original 6/22/207 NYT article embellishes this:
Three points on an I.Q. test may not sound like much. But experts say it can be a tipping point for some people — the difference between a high B average and a low A, for instance. That, in turn, can have a cumulative effect that could mean the difference between admission to an elite private liberal-arts college and a less exclusive public one.
I agree with Mark S. that this is very misleading, not to say a complete crock, and is probably motivated by the desire to make the story artificially attractive to readers. But as Mark asked, what's the Language Log angle?
The most obvious one is personal. And I don't mean "personal" in the sense that I have siblings, I mean "personal" in the sense that Frank Sulloway was my college roommate's college roommate. We lived together with 30-odd other undergraduates in a small cooperative dormitory that later became known as the "Center for High-Energy Metaphysics". So Frank, I've decided that you were right about Max Weber after all; but about this IQ and birth order business, I'm not so sure.
For one thing, I wonder what the relationship is between this research and the famous Flynn effect, a general world-wide rise over time in measured IQ scores, which requires IQ tests to be frequently renormed in order to keep the mean at 100. Thus according to Ulric Neisser, "Rising Scores on Intelligence Tests", American Scientist, Sept-Oct 1997,
The largest Flynn effects appear instead on highly g-loaded tests such as Raven's Progressive Matrices. This test is very popular in Europe; the Dutch data mentioned earlier came from a 40-item version of Raven's test. Using the 1952 mean to define a base of 100, Flynn has calculated average Dutch Raven IQs for subsequent years. The mean in 1982 was 121.10-a gain of 21 points in only 30 years, or about seven points per decade. Data from a dozen other countries show similar trends, which seem to be continuing into the 1990s.
So a Flynn effect of 21 points in 30 years translates to a rate that would take 3*30/21 = 4.3 years to generate a 3-point difference. This is probably not relevant to the Norwegian study's findings, since their data comes from tests of army recruits over a ten-year period, from 1967 through 1976; and I presume that there was no relationship between a young man's birth order and the date of his military service (though this is not explicitly discussed).
Still, it ought to give us pause that the birth-order difference was roughly the same as the effect of being born four years later.
More to the point, though, the media are (as usual!) treating these results as if a difference in group averages told us something about each individual member of a group. If you're born first, and your sibling is born second, then your IQ will be about 3 points higher than your sib's IQ, right?
Guess again.
The three-point difference came out of a statistical model of hundreds of thousands of Norwegian military recruits. If the model is correct, then a group of first-borns will have a 3-point IQ advantage over a group of later-borns -- on average. But IQ measurements are normed so that the standard deviation is 15. Let's ask R to generate 10 random "eldest child" values from a normal distribution with mean of 103 and standard deviation of 15:
> round(rnorm(10, mean=103, sd=15), digits=1)
[1] 117.7 121.0 108.4 114.4 77.3 103.3 120.1 83.9 92.5 81.5
And similarly 10 "younger child" values with a mean of 100:
> round(rnorm(10, mean=100, sd=15), digits=1)
[1] 105.2 84.5 96.7 91.7 82.1 90.1 100.3 100.5 104.9 105.7
Well, the older kid "won" the IQ bake-off 6 times out of ten. Is this the way it'll always come out? Not exactly. Let's generate fake IQ data for 1,000 imaginary first-borns and 1,000 imaginary non-first-borns:
firsts <- rnorm(1000, mean=103, sd=15)
others <- rnorm(1000, mean=100, sd=15)
In R, the comparison firsts>others gives us a vector of 1,000 values that is TRUE in those cases where an element of firsts is greater than the corresponding element of others, and FALSE otherwise. We can add up the TRUE values by using the expression sum(firsts>others), and we can turn this into a proportion by dividing it by 1,000:
sum(firsts>others)/1000
The result? Well, I just ran it and got 0.536 -- in other words, the first-born tested with a higher IQ 53.6% of the time. Is that the "true" value, the value we'd get every time? No -- if we run it 10 times,
X <- matrix(nrow=1, ncol=10)
for(n in 1:10){
firsts <- rnorm(1000, mean=103, sd=15)
others <- rnorm(1000, mean=100, sd=15)
X[n] <- sum(firsts>others)/1000
}
we get something like
0.563 0.569 0.554 0.582 0.555 0.569 0.528 0.556 0.538 0.560
This is giving us a plausible range of values, but it suggests that with a sample of 1,000 we can only tell that the answer is somewhere around 55%, plus or minus a few percent. So let's try 10 samples of 10,000:
0.5608 0.5544 0.5525 0.5555 0.5615 0.5534 0.5607 0.5651 0.5463 0.5516
and 10 samples of 100,000:
0.55422 0.55631 0.55587 0.55582 0.55594 0.55717 0.55939 0.55499 0.55892 0.55662
So if the study's estimate of the first-born's IQ advantage is correct, and all the other assumptions are correct too, it means that the first-born will have a higher IQ about 55.6% of the time. And therefore will lose the IQ contest about 44.4% of the time.
Another version of the same problem comes up when we evaluate the statement about "the difference between a high B and a low A". It's true that if there's a precise quantitative cut-off -- say 90% -- between one letter grade and another, then an arbitrarily small difference -- say 89.99 vs. 90.01 -- will make the difference between B+ and A-. This can be the basis of seemingly-endless discussions at grading time in undergraduate courses these days. And from my experience of such discussions, I can say that the factor of "being persistent in trying to persuade faculty to adjust borderline grades" is, alas, worth a lot more than 3 IQ points determining grade point average.
What about Frank Sulloway's discussion of admissions to his hypothetical two colleges,"a more prestigious institution for students with IQs above the mean, and a less desirable institution for all other students"? Well, let's try a Monte Carlo simulation in R, using Frank's value of 2.3 for the IQ difference between Norwegian first-borns and second-borns. One round might go like this:
firsts <- rnorm(100000, mean=102.3, sd=15)
seconds<- rnorm(100000, mean=100, sd=15)
m <- mean(c(firsts,seconds))
sum(firsts>m)
sum(seconds>m)
In this imaginary world, about 53.1% of the first-borns would get into the hypothetical "more prestigious institution for students with IQs above the mean", whereas only 46.9% of the second-borns would.
Now, Frank's hypothetical world is very different from the actual one. Even in countries where university admissions is determined strictly by test scores, it's not IQ tests that are used; and the power of IQ to predict scores on the actual admissions tests -- which are intended to test achievement at least as much as aptitude -- is probably modest. If someone knows the correlation of IQ scores with university admissions scores in (say) Japan, tell me and we can add to our imaginary world a model of the generation of admissions-test scores. No doubt we'd find that much of the (hypothetical) 53%-to-47% advantage would be washed out.
In the U.S., obviously, a much wider range of factors enters into admissions decisions. I can't prove that the resulting process removes even more of that hypothetical 53%-47% birth-order advantage, but I'd bet that it does. (If anyone knows anything about empirical relationships between IQ and U.S. college admissions, let me know that too.)
But even in Frank's highly-artificial world of hypothetically IQ-based college admissions, how does 53.1%-to-46.9% translate into his conclusion that
...an eldest child would be about 13% more likely than a secondborn to be admitted to the better institution (the relative risk ratio) ... and the odds of a firstborn being admitted would be 1.3 times as great.
Well, the "13% more likely" part is because 53.1/46.9 = 1.132. As for the part about "the odds ... would be 1.3 times as great", I believe that's because of the amazing magnifying power of the concept of "odds ratio":
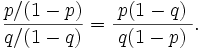
In this case, that works out to (.531/.469)/(.469/.561) = 1.354.
So what might have thought to be a 3% shift -- from 50-50 to 53-47 -- can be spun into an effect of more than 30%.
There's nothing mathematically incorrect about this, but it strikes me as a very questionable rhetorical tactic in a publication for general readers.
Now, the Norwegian study was large and careful and serious, and it found an apparently genuine effect of birth order, and (most important) it was able to look at the effects of birth order and "social order" (what happens when an eldest child dies young) separately, so as to disentangle possible biological effects of first vs. subsequent preganancies. But the birth-order effect, though real, is pretty small, and a responsible science journalist would do more to help readers to understand what an effect of this size does and doesn't mean.
[And then there's the test/retest issue... but enough.]
Posted by Mark Liberman at June 26, 2007 09:13 AM