August 07, 2007
Hand-waving in the Washington Post
According to Rick Weiss, "Gestures Convey Message: Learning in Progress", Washington Post 8/6/1007,
Teachers who use gestures as they explain a concept ... are more successful at getting their ideas across, research has shown. And students who spontaneously gesture as they work through new ideas tend to remember them longer than those who do not move their hands.
Weiss tells us that some new research by Susan Wagner Cook and others shows
... that even abstract gestures can enhance learning. In a classroom, she had some students mimic her sweeping hand motions to emphasize that both sides of an equation must be equal. Other students were simply told to repeat her words: "I want to make one side . . . equal to the other side."
A third group was told to mimic both her movements and words.
Weeks later, the students were quizzed. Those in the two groups that were taught the gestures were three times as likely to solve the equations correctly than were those who had learned only the verbal instructions, she and two colleagues reported in the July 25 issue of the journal Cognition. [emphasis added]
OK, time for a quiz. (Re-read the passage above, and feel free to gesture or not, as you like.)
In a post-test after the instruction, the students in the "Speech" group got an average of 2.0 out of six equations right. How many equations, on average, did the students in the "Gesture" group get right? (Justify your answer.)
If you've been paying attention, your answer will be something like "well, Weiss says that 'those in the two groups that were taught the gestures were three times as likely to solve the equations correctly than those who had learned only the verbal instructions'. And three times 2.0 is 6.0, so the kids in the Gesture group must have gotten pretty much all the equations right."
Bzzzt! No, sorry, the answer is 2.6 out of six, as you can learn by reading the research report, which is Susan Wagner Cook, Zachary Mitchell, Susan Goldin-Meadow, "Gesturing makes learning last", Cognition, in press.
How likely was this difference to have occurred by chance? Well, you can't tell just from the mean values, but according to the research report, the difference was evaluated as p=0.52, i.e. a difference in sample values of this size is likely to happen by chance about 50% of the time, when there is actually no difference in the underlying behavior being sampled.
What's going on? "Aha", you may be saying to yourself, "maybe it's odds ratios again".
No, that's not it (though it's something related).
The thing is, the effect that Weiss is talking about didn't show up during or immediately after the controlled teaching experiences. Instead, it showed up in a delayed test, four weeks later.
OK, so what was the difference in performance between the Speech and Gesture groups then?
Unfortunately, I don't know. The research report doesn't provide this useful piece of information.
Instead, the experimenters reason as follows:
If children retained the knowledge learned during the math lesson, we should be able to predict their performance on the follow-up test 4 weeks after instruction from their performance on the posttest immediately following instruction. We used a regression model to predict follow-up test performance, using posttest performance and condition (Speech, Gesture, Gesture + Speech) as factors. As is evident in Fig. 2, regression coefficients differed across the three groups (F(2, 78) = 5.79, p = .0045). The unique predictive power was significantly greater for the Gesture (β = .80, t(28) = 7.94, p < .0001) and Gesture + Speech (β = .92, t(23) = 12.00, p < .0001) groups than for the Speech group (β = .33, t(27) = 1.89, p = .069); t(78) = 2.64, p < .01 and t(78) = 3.22, p < .01, respectively.
OK, fair enough. I'm convinced that the use of hand gestures in this experiment improved the correlation between post-test performance and follow-up test performance. (Weiss's "three times" appears actually to refer to this difference in test-performance correlation, not to any difference in performance.)
The fact that use of hand gestures increased the correlation between post-test scores and follow-up test scores is interesting and meaningful. But I'd rather know how much the use of hand gestures actually improved follow-up test performance, and I'm puzzled that the authors didn't tell us that. Could it be because their experimental manipulation didn't produce a statistically significant difference in the follow-up scores either?
I think this might be true. While the paper doesn't provide the raw test scores (though a small table would have sufficed to do this), there is a scatterplot showing the follow-up scores vs. the post-test scores for each of the three conditions:
Fig. 2. The top panel displays regression lines relating performance on the 4-week follow-up to performance on the immediate posttest. The bottom three panels display scatterplots of the number of problems solved correctly on the follow-up test and the posttest by condition (Gesture + Speech, Gesture, Speech). The size of the dot at each point represents the number of children who fell at that point.
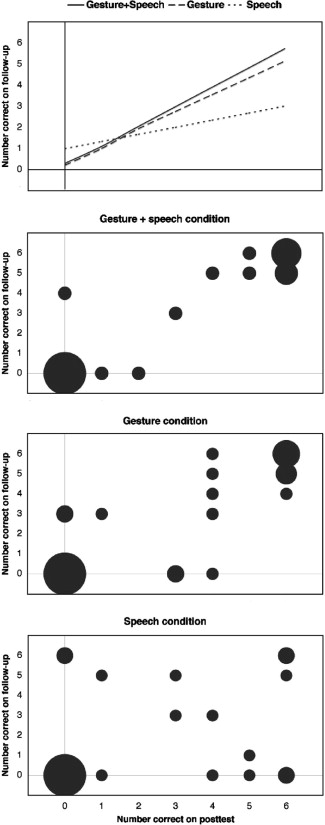
Based on measuring the dots in these plots, I deduce the following table of follow-up scores for the Gesture and Speech conditions (where as in the plot, the number in each cell represents the number of students with each score):
| 0 | 1 | 2 | 3 | 4 | 5 | 6 | |
| Gesture | 10 | 0 | 0 | 7 | 4 | 5 | 6 |
| Speech | 12 | 2 | 0 | 4 | 0 | 6 | 6 |
This doesn't quite tally with the other information in the report, which says that there were 30 (rather than 32) students in the Gesture group, and 29 (rather than 30) in the Speech group; but I don't see any other way to get numbers from the graph. (Maybe there is some sort of round-off error resulting from taking proportions and scaling back to integer circle sizes?)
The average follow-up score of the Gesture group in this reconstruction is slightly higher than the average follow-up score of the Speech group -- 3.1 correct out of 6 vs. 2.7 correct out of 6 -- but there's no way the difference is statistically significant. (The p value in a t test is about 0.53 -- but if you think I've got this reconstruction wrong, and especially if you know the actual numbers from this study, please let me know.)
Looking at the scatterplots and the regression lines, you can see what the researchers are getting at. The difference in teaching methods is having some effect, and their comparison of regression coefficients seems to be a plausible way to get at it.
But there's no warrant whatever in the paper for Weiss's interpretation that "Those in the two groups that were taught the gestures were three times as likely to solve the equations correctly than were those who had learned only the verbal instructions". In fact, depending on which test you look at, the difference seems to have been something like 15% to 30% (and not statistically reliable), not 300%.
Now, this misunderstanding is Weiss's fault, He should be able to read the paper and understand that it absolutely and categorically doesn't say what he says it says. If he wasn't sure, he should have asked one of the authors when he interviewed them.
But in this case, the authors bear some of the responsibility, for failing to note a very relevant and (apparently) negative result, and leaving out the simple table of raw scores that would have allowed readers to draw their own conclusions.
A table in the form that I gave above, providing all the numbers in the scatter plot, would have had just 3 tests by 3 conditions by 7 outcomes, or 63 cells. The full table of raw scores is just 84 subjects by three test scores = 252 numbers. It could easily have been provided as online supplemenary materials, if not as a small-type table in the text itself. I'm surprised that the editors and reviewers at Cognition didn't insist on this, but psychology journals often provide regression or anova results, without giving the data they were based on, or even simple descriptive summary statistics. (I bear some personal responsibility here, since I once did a stint on the editorial board of Cognition, and I never tried to change their policies in this respect.)
So let me add another commandment to the decalogue of scientific rhetoric: Thou Shalt Report Raw Numbers. This is really directed at scientists, not journalists -- but you journalists should ask for the numbers, if you don't see them in the research report. Sometimes the raw numbers are so noisy you can't see the signal, and only sophisticated statistical analysis let's you see what's going on; but when that's true, you need to think about what it means for the functional significance of the effect.
I don't really expect my rhetorical decalogue to have much impact on the way people act, any more than the original one does. We're swimming upstream against the current of human nature, in a system where journalists (and for that matter scientists) are paid to get your attention. But it might have an effect on how people (including the scientists who review papers) interpret what they read.
[Update -- an informative response from Susan Wagner Cook:
I saw your comments on the recent press coverage of our Cognition paper: "Gesturing makes learning last" and thought that I could provide a bit more context. I agree wholeheartedly that the statement in the Washington Post article is a mischaracterization of our findings, and I appreciate this being brought to light. The statement should be qualified as follows: Of children who learned to solve the problems correctly during instructions, those in the two groups that were taught the gestures were three times as likely to solve the equations correctly three weeks later than were those who had learned only the verbal instructions.
With regards to the data analysis, your characterization of the data is right on target. We felt that including the scatterplots provided a descriptive picture of the data, however, perhaps quantifying the relations would have helped avoid misinterpretation. I am not sure what algorithm Excel uses to calculate the circle sizes in bubble plots, and whether it relates to radius, area, or diameter, but the actual data look like this:
0 1 2 3 4 5 6 Mean Speech 18 1 0 3 0 3 4 1.68 Gesture 15 0 0 4 1 4 6 2.4 Speech+Gesture 12 0 0 1 1 5 6 2.72 In an ANOVA with condition as a factor, these differences are not significant, F(2,81)=1.15, p=.32.
However, this analysis leaves out an important source of known variability on the follow-up, post-test performance, and accounting for this variability in the analysis improves statistical power by decreasing error variance. There should be a strong relation between post-test performance and follow-up, particularly if the experimental manipulation is affecting learning. Children who solve the problem correctly on the follow-up who did not solve the problem correctly during training or on the posttest are likely to have learned in the intervening period, while they are receiving mathematics instruction in their classrooms, not from our instructions.
The regression analysis reveals that children in the two conditions including gesture are maintained the learning they showed during our instruction. They are performing comparably on the posttest and the follow-up - maintaining nearly all of the learning they showed during our instruction. In contrast, in the speech conditions, children's follow-up performance in not related to their performance during out instruction, suggesting that whatever correct performance is observed is not related to our instructional manipulation, but rather to factors in the intervening period. Indeed, if the speech manipulation were difficult even for some students who were ready to learn the concept, then we would even expect proportionally more students in this condition to learn in the intervening period, precisely because they could not learn from our instructions.
Thank you for raising some important issues and for your thoughtful attention to our paper!
I guess that Excel must be using relative area (which makes sense, on reflection), whereas I was measuring relative diameter. All the more reason to give a table of the data, which I'm thankful to see!
Some other relevant work: Lindsey E. Richland et al. "Cognitive Supports for Analogies in the Mathematics Classroom", Science 316(5828)1128-1129, May 2007, which suggests that using a scale balance to teach equations is a good idea -- it would interesting to compare the value of a physical prop like a scale balance with the (less expensive but less concrete) balancing gestures used in this study. ]
Posted by Mark Liberman at August 7, 2007 07:27 AM