October 04, 2007
The "gender happiness gap": statistical, practical and rhetorical significance
A couple of weeks ago, two economists at Penn (Betsey Stevenson and Justin Wolfers) finished a paper about changes over time in women vs. men's self-reported happiness. As usual in social science research, it deals with changes in the distribution of the characteristics of individual members of large and diverse groups.
A few days later, David Leonhardt promoted this research in a New York Times article, along with some other recent work by Alan Krueger. As usual in popular understanding of scientific research, this article's readers concluded that the research revealed properties of all the typical individuals in the groups studied, and especially of themselves. At least, that was the reaction of the hundreds of readers who contributed impassioned and often touching comments, both on the NYT site and in other web forums, and put Leonhardt's article on top of the "most emailed" list for several days.
Several friends and acquaintances mentioned the article to me in passing, and their reactions were similar to what I read online. Women used to be happier than men; now men are happier than women; does this mean that feminism has failed, or that it has succeeded, or that it has partly succeeded and needs more effort, or what? Does this mean that that I (or my partner) should do more (or less) of the housework and childcare, or spend less (or more) time on career development, or worry more (or less) about personal appearance, or put more (or less) effort into hobbies and personal relationships?
Those are all good questions, but I wondered how much they really had to do with the original research. The rhetoric of science journalism -- and sometimes the rhetoric of science -- all too easily engages a sort of pop-Platonism that seems to be deeply connected to the way that we think about natural kinds. As a result, small (but statistically reliable) differences in group distributions are seen as essential properties of the groups themselves, and therefore of all the individuals that make them up. Or at least, all the normal or typical individuals. Intellectual and social mischief often ensues.
I wondered to what extent this might have happened in the "happiness gap" case, so I looked into the original papers. I found what I suspected I might -- the changes between groups and across time are small enough, relative to within-group variation, that you need a sophisticated mathematical analysis to see them. So I pointed this out in a couple of blog posts.
Further responses by various parties ensued. To say the least. (You can follow the whole thing in the list of links at the bottom of this post, if you want.)
In particular, Justin Wolfers wrote a couple of blog posts at Marginal Revolution -- "The Significance of Changes in the Gender Happiness Gap", 10/2/2007; and "The Real Significance of Changes in the Gender Happiness Gap", 10/3/2007).
I agree with the implication of Justin's titles -- the second post is much more interesting and important than the first.
In the first post, he argues that I misinterpreted the lack of asterisks (traditionally used to signal statistical significance) on certain lines in their Table 1. I took the missing asterisks to indicate that the analysis of the individual years 1972 and 2006 showed no statistically significant sex difference in self-reported happiness. Here's the table:
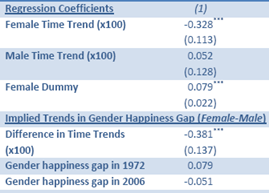
And here's what he says about it:
The right way to test for whether women were, on average, happier at the start of the sample is to look at the "Female dummy", which is clearly significant. The right way to ask whether this gender gap has changed is to look at the difference in trends, which is also clearly significant. The last two rows are regression-based predicted values, so we didn't think we should put stars next to these numbers.
OK, my bad. Justin goes on to show that you can limit the regression analysis to just trends in male vs. female happiness inferred from comparing the two years 1972 and 2006, and that when you do, you discover that in predicting the "%Very happy" proportions, "no coefficients are statistically significant", whereas in modeling the "%Not too happy" proportions, all the coefficients are statistically significant.
This is not quite the analysis I had in mind -- I assumed (incorrectly) from their Table 1 that if you analyzed only the data from 1972, or only the data from 2006, not looking for trends over time but just asking about the distribution of responses by sex in a given year, you would not find a statistically significant difference in men's and women's self-reported happiness in either year. (It turns out that the difference was statistically significant in 1972, but not in 2006, according to what Justin says later in the same post.)
But it doesn't matter, because my objection was never about statistical significance, but rather about effect sizes and practical significance, and especially what individual men and women should conclude that this means for them. When I mentioned the need to look at multi-year data to see the trend (although there are thousands of people involved in each year's survey), this was not an attempt to nit-pick the statistical analysis; it was one of a number of ways that I tried to get readers to see this research in terms of (fairly small) shifts in (heavily overlapped) male and female distributions, not in terms of (large, even qualitative) changes in the individual properties of men and women as instances of uniform categories, or in the properties of male and female prototypes.
With respect to the arguments about statistical details, it's hard to improve (rhetorically, if not mathematically) on what Jezebel ("Celebrity, Sex, Fashion, Without Airbrushing") wrote yesterday afternoon, under the category of jezenomics ("Women Have Gotten Less happy, I'll Take My Graphing Calculator Out And Prove It":
Remember that study on women being less happy than men? Sounds about right, right? The internerds thought so! (Different ways internet commenters said no shit: "Boo hoo, the feminists made their bed and now they have to lie in it with their cats" and "Men are dogs. Dogs are happy. The end" and "Duh, we get Halo, and you get periods." ) But hold on! Some linguists think it's not true! It's an academic freestyle battle! So after the linguists called bullshit (and by the way, what the fuck is up with linguists knowing everything about everything?) the original economists who published the study struck back to say the linguists were wrong, women really were unhappier, and here's their proof:
* Gender happiness gap at the beginning and end of the sample
oprobit HAPPY SEX [aw=wt] if YEAR==1972
oprobit HAPPY SEX [aw=wt] if YEAR==2006
* Changes in the gender happiness gap using only the first and last years
xi: reg vhappy i.SEX*i.YEAR[aw=wt] if YEAR==1972 | YEAR==2006
xi: reg unhappy i.SEX*i.YEAR [aw=wt] if YEAR==1972 | YEAR==2006Ha ha ha ha, here's a little regression theory for you guys! (Get it? Blow me! Don't you think I'd be happier if you could?)
Maybe the real happiness gap started setting in whatever year it became popular for economists to stop working on the economy by day and getting their wives off at night and started applying advanced calculus to every single mundane happening in their lives including though not limited to why their wives were faking it! Because that happened in 2004.
As Justin Wolfers, who sent me the link, put it: "Funniest thing I've read on a blog in a long time..." After reading it, I think I won't follow my first impulse to ask Justin for the dataset so that I can try some other analyses.
Justin's second Marginal Revolution post takes up some aspects of what I think is the real question here:
As Deidre McCloskey has argued, we shouldn't be in the business of "asterisk econometrics", but instead, figuring out what effects have "oomph".
I can add another Deirdre McCloskey link to Justin's collection here: her Prickly Paradigm Press pamphlet The Secret Sins of Economics, which I blogged about back in September of 2004. What she has to say is fundamental to the scientific side of this whole discussion, and I can't resist quoting her peroration:
Cassandra, you know, was the most beautiful of the daughters of Priam, King of Troy. The god Apollo fell for her and made her a prophetess. In exchange he wanted sexual favors, which she refused. So he cursed her, in a most malicious way. He had already given her the power of prophecy, to know for example what would happen to a science that refused to ask seriously How Much. His curse was to add that though she would continue to be correct in her prophecies, no one would believe her.
Cassandra [to Trojan economists proposing to bring the wooden horse into the city]: The horse is filled with enemy soldiers! If you bring it into the city, economics is lost! Please don’t!
Leading Trojan Economist: Uh, yeah, I see what you mean, Cassie. Good point. Enemy soldiers. Inside. City lost. Qualitative theorems useless for a science. Statistical significance without a loss function equally useless. Economics ruined. Thanks very much for your prophecy. Great contribution. Love your stuff.
[Turning to colleagues] Okay, guys, let’s bring that sucker in!
Turning back to the public rhetoric of science, what Justin Wolfers has to say about the "oompf" of the "happiness gender gap" is cogent and absolutely to the point. You should read his whole post, if you're interested in the topic, but I'd like to comment on two of his suggestions. In general, these are versions of exactly the issues that I raised in my earlier posts:
Her [sic] are a few ways of thinking about the magnitude or "oomph" of the change we document:
- Effect Sizes: The coefficient in an ordered probit can be thought of as an "effect size", and hence the relative decline in the happiness of women is roughly one-eight [sic] of one standard deviation of the distribution of happiness in the population. If you think there is a lot of variation in happiness in the population, this is big; if not, it is small.
It's true that in marketing or politics or sports, an effect size of 0.125 can make your fortune, swing an election, or win the division. And the more the variance in the population, the bigger the effective size of the change you can make by (say) improving your cardiovascular capacity by an eighth of a standard deviation. But more generally, as the Wikipedia article explains, "the most accepted opinion is that of Cohen (1992) where 0.2 is indicative of a small effect, 0.5 a medium and 0.8 a large effect size".
And in particular, when we're talking about the popular interpretation of group differences, effect sizes in the range of 0.1 to 0.2 are really problematic. When ordinary people come to understand how much overlap in the distributions such effect-sizes entail (see my post "Gabby guys: the effect size" for a concrete example), they generally discard the difference as insignificant. This is wrong, but it's wronger to conclude that effect sizes in that range (which are easily shown to be statistically significant, if you have enough data) tell us something about general properties of pop-Platonic prototypes.
Justin's second suggestion for evaluating oompf:
- Changing Positions: Let's think of lining up all the men in 1972, in order of their happiness. In 1972, the median woman ranked between the 53rd and 54th man, happier than a slight majority of men. By 2006, the median woman is somewhat less happy, ranking between the 48th and 49th man. (A point of comparison: Moving from the 53rd to the 48th percentile of the household income distribution involves a difference of about $6,000 per year.)
Here's how I presented the same idea in my first post on this topic:
OK, so imagine coming into a door labeled "the room of unhappy people". You enter, and find yourself in a hall with 51 to 54 women, and 46 to 49 men. Do you think that you could decide which sex predominated, without lining everyone up and doing an explicit count?
Now imagine that you walk through two such rooms, where the first one is around 51-to-49 female, and the second is around 54-to-46 female. Do you think that you would notice the direction of difference in the sex ratios, without another pair of line-ups?
More to the point, do you think that you could spin differences like these into today's second-most-emailed NYT story?
If your answer is "yes", then you may have a future as a science writer. (Or, perhaps, as an economist...)
(I used the percentile estimates in the Stevenson-Wolfers paper based on projecting the 2006 median woman and man back onto the 1972 distribution, which is why the particular numbers are a little different. I think.)
Justin's point is that a percentile shift of this size is important. From some points of view, I'm sure that's true. In particular, as he goes on to explain, you'd need a very large change in e.g. unemployment statistics to cause a similarly-sized effect on self-reported happiness.
However, it remains true that the way that men and women reported their own happiness didn't change very much. In his imaginary line-up, the median woman is only moving by 5 places out of 100 over 34 years, and is ending up less than two places out of 100 below the median man. But the public clearly interpreted this research as showing that women as a group are now quite unhappy, both absolutely and also relative to men.
The empirically-observed trend, in which women have shifted over 34 years from self-reporting on average as a bit happier than men to self-reporting as a bit less happy, could be the result of a tiny shift in most people's moods, or a somewhat larger shift in a few people's moods; but it was interpreted by the public as a qualitative change in almost everyone's mood, to an extreme endpoint.
That's how the public rhetoric of science usually works, unfortunately, and that's why I (as a linguist and also as a citizen) was interested in the topic.
If you want the whole shaggy dog story, here's a list of the sequence of points and counterpoints (including only a small sample of the blog and forum reactions):
8/23/2007: Alan B. Krueger, "Are We Having More Fun Yet? Categorizing and Evaluating Changes in Time Allocation", ms. (Princeton U. and NBER).
9/16/2007: Betsey Stevenson and Justin Wolfers, "The Paradox of Declining Female Happiness", ms. (University of Pennsylvania).
9/26/2007: David Leonhardt, "He's Happier, She's Less So", NYT.
9/26/2007: Jezebel, "Women Less Happy Than Men About Performing Every Single One Of Those Multi Tasks".
9/26/2007: digg.com, "
Men Are Now Happier Than Women".
9/26/2007: Mark Liberman, "The 'happiness gap' and the rhetoric of of statistics", Language Log.
9/27/2007: Mark Liberman, "Gender-role resentment and rorschach-blot news reporting", Language Log.
10/1/2007: Steven D. Levitt, "Why Are Women So Unhappy?", Freakonomics Blog (NYT).
10/1/2007: Mark Liberman, "Why are economists so misleading?", Language Log.
10/2/2007: Jill Filipovic, "Feminists made their bed, now they have to lie in it alone with their cats", Feministe.
10/2/2007: Amanda Marcotte, "Women: Not really that unhappy avoiding scowling cretins and petting cats", Pandagon.
10/2/2007: Justin Wolfers, "The Significance of Changes in the Gender Happiness Gap", Marginal Revolution.
10/3/2007: Echidne, "The Gender Happiness Gap", Echidne of the Snakes.
10/2/2007: Jezebel, "Women Have Gotten Less happy, I'll Take My Graphing Calculator Out And Prove It".
10/3/2007: Justin Wolfers, "The Real Significance of Changes in the Gender Happiness Gap", Marginal Revolution.
10/3/2007: Steven D. Levitt, "The Debate on Female Happiness Heats Up", Freakonomics.
[Update -- a reader writes:
Last weekend, I saw Justin Wolfers give a talk on his paper "Racial Discrimination Among NBA Referees" at the Stats in Sports conference at Harvard. In the paper, he demonstrates that the racial composition of an officiating crew has a significant effect on the number of fouls called, given the race of the player who committed the foul.
I work as a statistical analyst for a pro basketball team. Many people in the front office called me to talk about the paper, asking for my interpretation. I had to explain that while the results were statistically significant, and that the paper was extremely well done (a rare occurrence when academics step into the sports arena), the effect size was so small that it was overwhelmed by less controversial aspects of the game.
Moreover, I explained that you couldn't make decisions based on these results, since the effect was visible only over a large dataset and that the bias was not tied to any particular player or official, but only the aggregate of all players and officials.
Your posts on gender happiness brought all this back to me. Most people have a very hard time understanding variation within populations. Much of my job is pointing out when the variation is so large that any talk about the "average" is practically meaningless -- which leads to the spectacle of the stats analyst arguing against using stats analysis and for subjective evaluations.
I don't know anything about economics, but I get the feeling that their papers are never about what they're about. Justin's talk used racial bias in basketball to make a larger point about racial bias in society -- but most readers (including me) are primarily concerned with what it says about basketball. I think the same thing is happening here with the gender happiness thing.
]
Posted by Mark Liberman at October 4, 2007 10:24 AM