October 09, 2006
Poem in the key of what
Being a positive and constructive kind of person, I'm really tired of complaining about bad science writing and similar negative stuff. So to strike a more hopeful note, I've spent three full breakfast blogging sessions, over the past week or so, exploring some interesting ideas that I found in a recent paper by Maartje Schreuder, Laura van Eerten & Dicky Gilbers, "Speaking in major and minor keys" [hat tip to JC Reed]. (I don't mean that I've written three blog posts, alas -- only that I've spent about two hours, spread over three days, producing this post.) Below, I'll explain what I've found, and give pointers to some programs that you can use to continue exploring on your own, if you're interested in such things.
The idea behind this paper is that the pitch contours of speech naturally express the same sorts of melodic intervals that occur in music. This is an old idea, prominent already in Paṇini's work two and a half millennia ago, but Schreuder et al. have a new idea about how to look for the phenomenon. While it's clear that musical intervals are part of the stylized forms of speech that we call "chanting", I've always been skeptical that well-defined intervals (in the sense of small-integer ratios of pitch values) play a role in unchanted speech. I'll explain some reasons for my skepticism later in this post. However, it would be fun to be wrong on this one.
Here's what Schreuder et al. did:
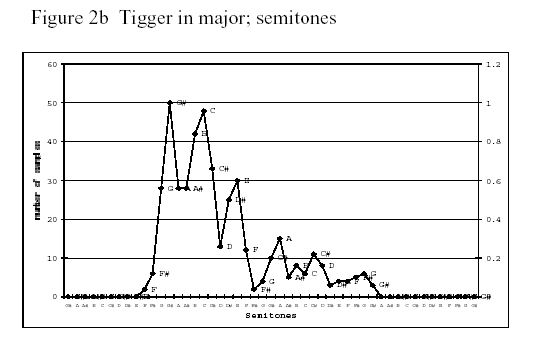
In order to obtain different emotions in speech, we asked five primary school teachers to read selected passages in Dutch from A.A. Milne’s Winnie the Pooh, in which Tigger, who is energetic and happy, and Eeyore, who is distrustful and sad, are presented as talking characters. We expect that Tigger represents a major modality, and Eeyore a minor modality in their speech. [...]
The passages in which Tigger and Eeyore were speaking were extracted and concatenated to ten files each varying from 8 to 53 seconds. These files were sampled every 10 milliseconds and the pitch data of each sample were obtained using PRAAT. In this way we obtained a pitch contour which we compared to the original one. Because of the great similarity, we decided that the sample rate of 10 milliseconds was sufficient for our experiment.
Subsequently, we did a cluster analysis of the pitch data in order to find out which frequencies occurred most in each contour. [...] The obtained pitch values were clustered i.e. rounded off downwards or upwards to the value of the nearest semitone.
And here are samples of their results:
 |
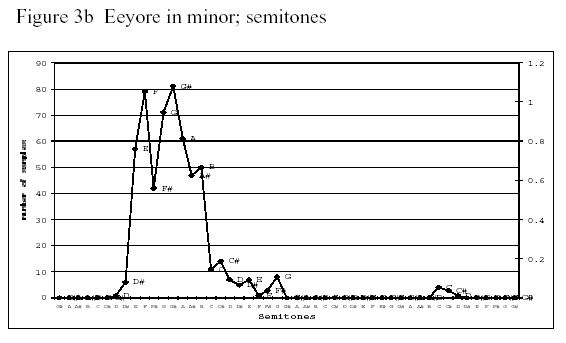 |
I'm not 100% convinced by these plots; and also I think their selected examples might be stacking the deck a bit, since Eeyore is stereotypically (since the Disney movie, at least) someone who signals a depressed state by speaking almost in a chant, in which minor-third intervals are prominent. But still, this is really interesting stuff.
To see how this general approach might work, let's start out by trying it on some singing. I picked the first couplet of Janis Joplin's a capella prayer (from Pearl, 1971):
Oh Lord, won't you buy me a Mercedes Benz?
My friends all drive Porsches, I must make amends.
Here are the waveforms and pitch tracks for these two lines (an audio clip is linked to the pitch contour display):
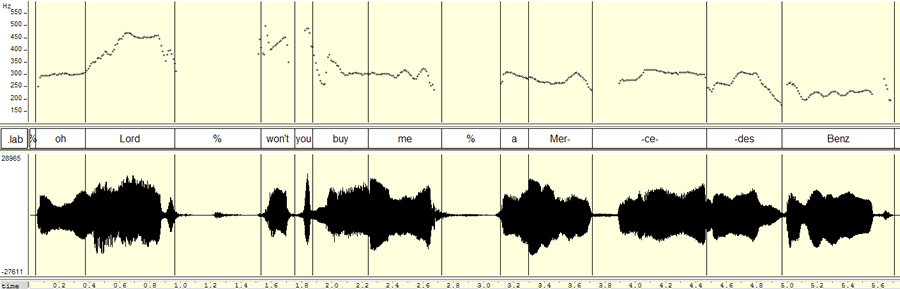
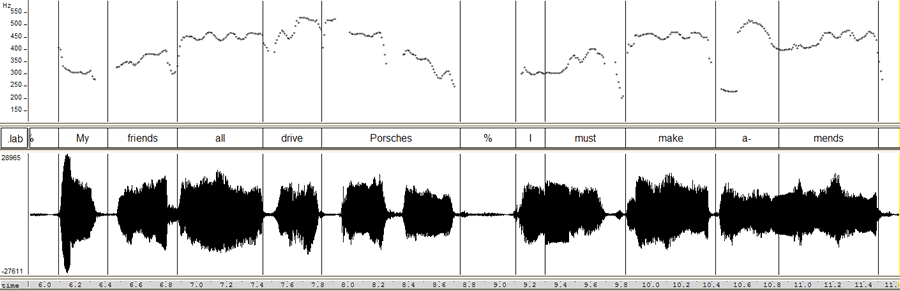
(I've used the free software program WaveSurfer here, rather than the free software program Praat, which Schreuder et al. used. Both programs are excellent -- Praat has many more features, and is more widely used; WaveSurfer is perhaps somewhat easier to learn to use in simple ways, and its pitch tracker (originally written by David Talkin when he was at Entropic Research Laboratory) seems to be somewhat better, overall). The most obvious approach to checking out the pitches would to look at the average fundamental frequency of particular syllables; here that might get us e.g.
Word |
Average F0 |
Note (in abc notation) |
Oh |
299 |
D+ |
Lord |
454 |
A+ |
buy |
302 |
D+ |
Mercedes |
288 |
C#+ |
Benz |
226 |
A,+ |
interpreted with respect to the pitches of equally-tempered semitones relative to A 440:
| A | A# | B | C | C# | D | D# | E | F | F# | G | G# | A | A# |
| 220 | 233 | 247 | 262 | 277 | 294 | 311 | 330 | 349 | 370 | 392 | 415 | 440 | 466 |
Thus this couplet features pitches that are about a quarter-tone sharp relative to D, A, C#. But as Schreuder et al. suggest, we can also see this by looking at a histogram of pitch estimates. So I asked WaveSurfer to write out its F0 estimates for each centisecond of the two phrases shown above (right-click on the pitch pane, select "Save Data File"), and used the free software program R to calculate a histogram in quarter-tones relative to A 440 (the functions that I wrote to help do this are here).
I used a histogram in quarter-tones, rather than rounding the data off to the nearest semitone as Schreuder et al. did, because I thought that might be more revealing. (Actually, I started out using eighth-tones, but I decided that was unnecessarily finely divided.) Anyhow, the result shows us peaks at pitches similar to those that we measured locally:
OK, cool! There's much more to be explored here -- but it's clear that there are well-defined modes in the histogram, and surely they must correspond to the pitches of the sung melody. But what would we see if we looked at something spoken rather than sung? Well, it happens that Janis introduces that song with a spoken phrase:
Like to do a song of great social and political import.
so here's the same analysis, starting with the pitch contour:
and continuing with the quarter-tone histogram:
Cool -- modes again! Does this phrase really feature pitches (just sharp of) C, D, F and G? Or is this some sort of artefact? Maybe a bit of both, but in any case, this way of looking at F0 distributions seems really interesting and suggestive.
Let's try something else -- the start of Sylvia Plath reading her poem "Daddy":
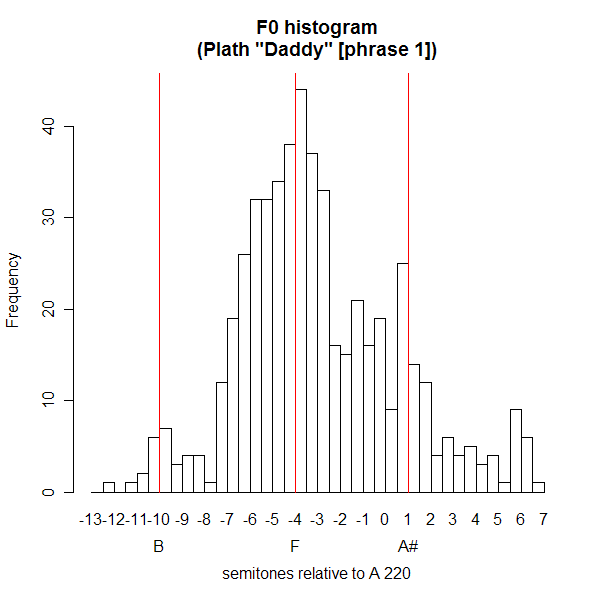
Modes again! That's modes in the sense of "peaks in a distribution" -- but maybe, as Schreuder et al. believe, it's also modes in the sense of "organized set of musical pitch classes"... And here's the histogram for the whole poem:
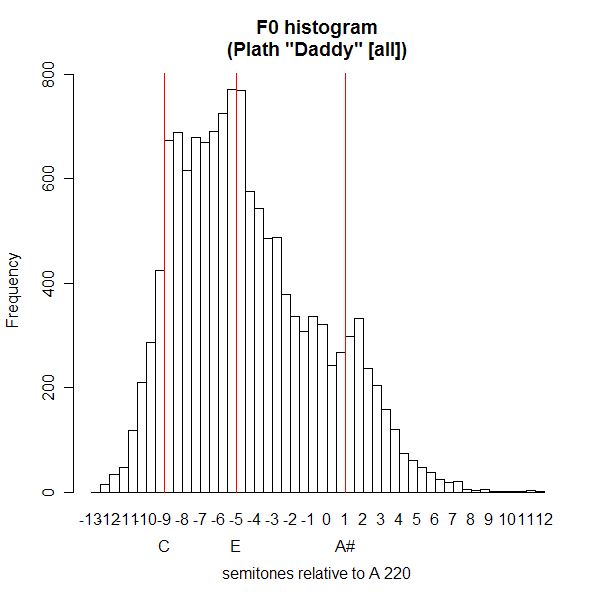
Hmm. The modes are less clear -- pitches drifting around a bit in the performance? -- but still, it's not at all the smooth distribution that I might have predicted. (By the way, the script for producing the two previous histograms is here.)
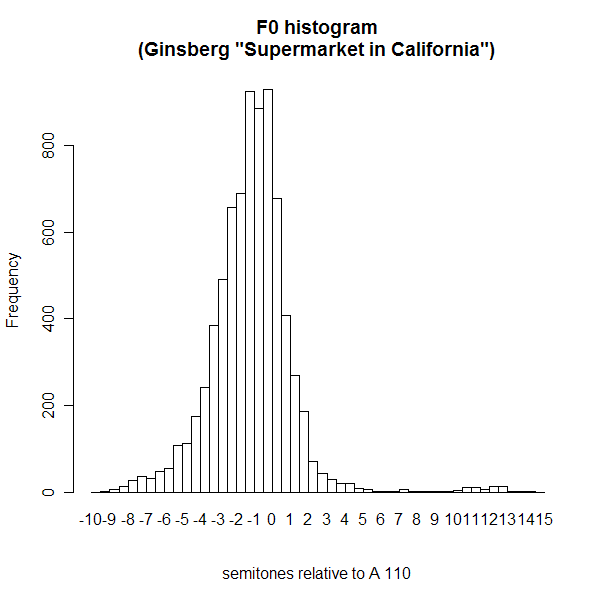
Or, for example, the (fairly) smooth distribution that we see, more or less, in Alan Ginsberg's reading of his poem "A Supermarket in California":
FYI, here are the pitches of the relevant region of the tempered chromatic scale for Sylvia Plath's pitches -- you can divide them all by two, roughly, for Alan Ginsberg's pitch range.
| A | A# | B | C | C# | D | D# | E | F | F# | G | G# | A | A# |
| 110 | 117 | 123 | 131 | 139 | 147 | 156 | 165 | 175 | 185 | 196 | 208 | 220 | 233 |
OK, one last example, a phrase from a random radio talk show (Marty Moss-Coane's Radio Times, 8/10/2005):
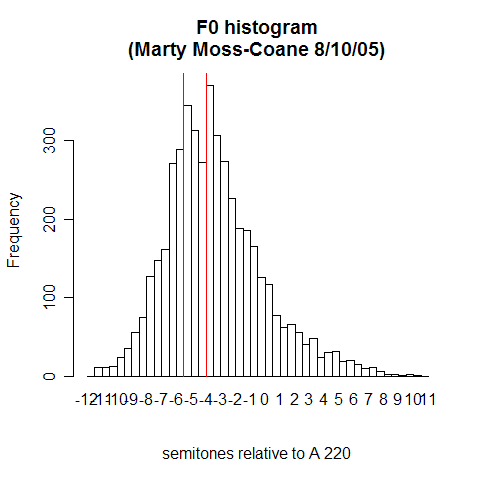
Well, this is going to take some further investigation -- but, as the old Russian expression goes, it smells of horizons.
As for why I've always been somewhat skeptical about this whole musical-intervals-in-speech business, it goes like this. (You can find a more extensive discussion of these general issues in Mark Liberman and Janet Pierrehumbert, "Intonational invariance under changes in pitch range and length", pp. 157-233 in M. Aronoff and R. Oehrle, Eds., Language Sound Structure, MIT Press, 1984. The plots below are all taken from that paper, and if you don't follow the rather sketchy discussion here, you can read more about it in the scan of the paper that I've put online.)
Let's ignore the fact that pitch contours in speech rarely involve steady values maintained long enough to give a clear impression of a well-defined "note", but rather usually involve glissandi or pitch slides. After all, some melismatic styles of singing also rarely rest very long on any one pitch value. So is speech just an especially melismatic form of singing?
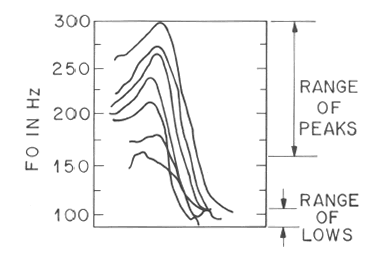
The first point to be made is that a given spoken phrase can be produced in a wide variety of pitch ranges. And the scaling of corresponding pitches does not, in general, preserve musical intervals. For example, as you "raise your voice" (for example so as to speak to someone who is further away, or to speak over a louder level of background noise), the high pitches generally go up by higher multiples than the lower pitches do:
In addition, there is a tendency (known as "declination") for pitch contours to slope downwards, on average, within a phrase. For example, we took the first few dozen phrases from a radio news broadcast (spoken by a single speaker), normalized their time spans to a constant length, and averaged the F0 by position. The resulting plot looked like this:
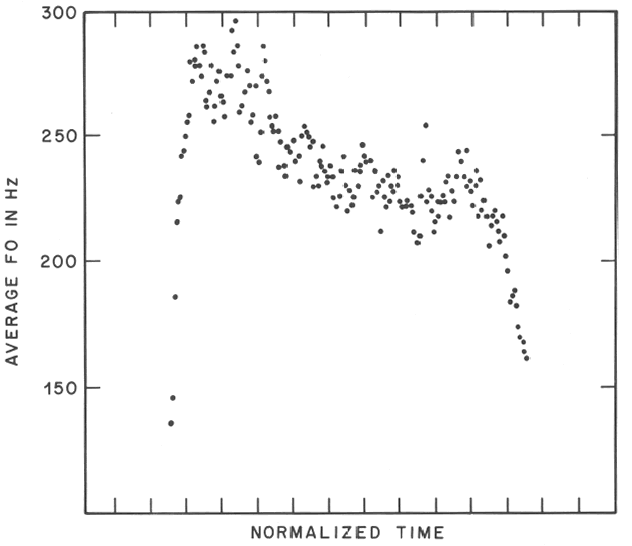
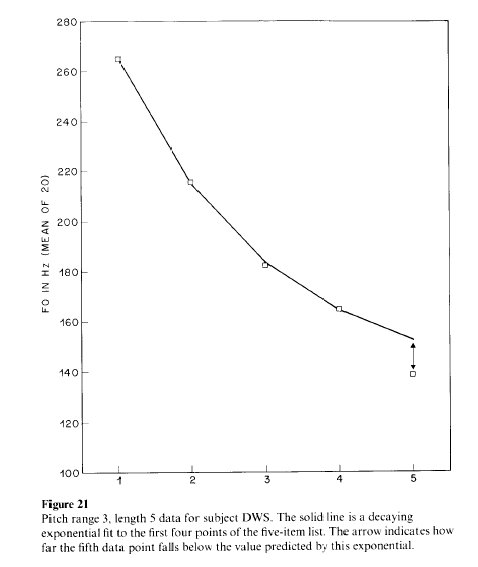
As we explain in the cited paper, there are several different factors leading to this declination tendency. But in this context, what matters is that local pitch relationships are shifted up and down depending on their location in a phrase; and the shifting, again, is not strictly multiplicative, as it would need to be if musical intervals were to be preserved. One way to see that is to observe that the down-drifting of relatively-high-pitched stressed syllables follows an exponential decay to a non-zero intercept -- except for the final one, which is lowered further:
There are other ways to see that pitch scaling in speech does not preserve musical intervals -- or in other words, does not follow purely multiplication patterns. For example, we can look at the relationship of peak values in double-focus phrases with "foreground" and "background" accents, like these:
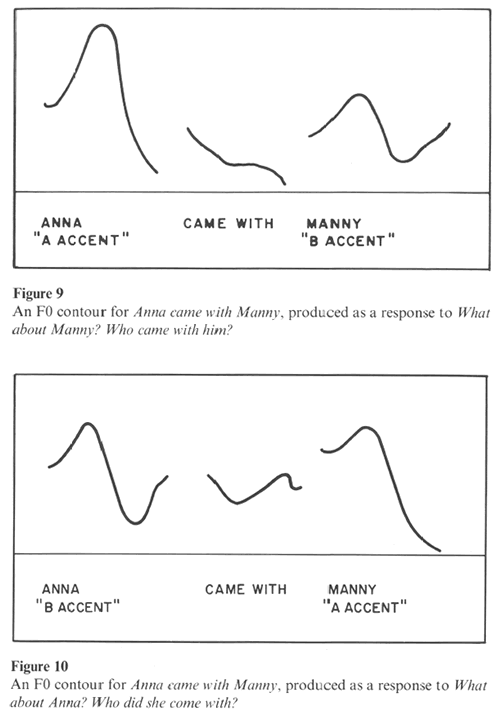
As we vary pitch range (in this case, by asking the subject to address someone at different distances), this relationships varies in lawful ways, which can be well approximated by simple models of a type discussed in the cited paper. The figure below shows some experimental data and the fit of a particularly simple model:
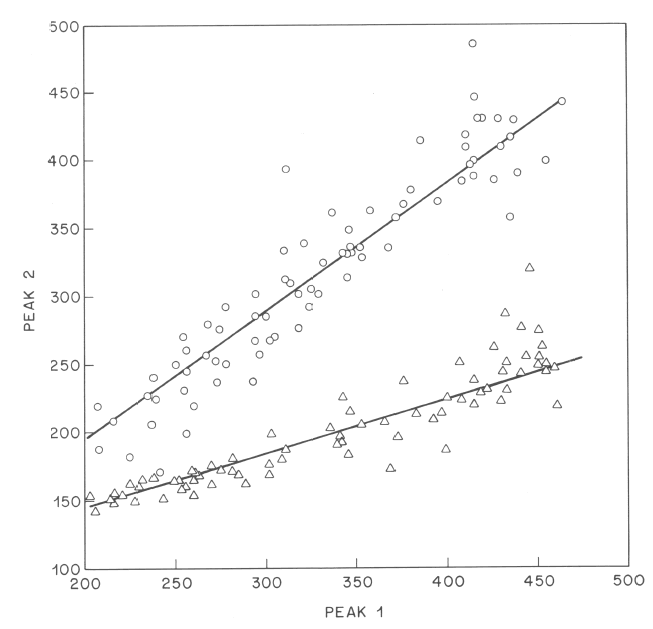
You can see that the relationship between the peak pitch of the first accent and the peak pitch of the second accent can be approximated by a straight line. However, if the relationship were that of a fixed musical interval, the intercept of the line should be zero -- but these lines have clearly non-zero intercepts.
As discussed in the linked 1984 paper, this is basically the same fact as the existence of the non-zero asymptote in the declination data. A simple version of this story is that each person has a "baseline" pitch value, and that higher pitch values scale proportionally above this baseline. This predicts that pitch relationships in speech should have an additive component as well as a multiplicative one, and this is indeed what seems to happen. It's hard to square this with a view of intonation that gives a key role to musical intervals, much less scale types such as major and minor (not to speak of Dorian, Mixolydian, Bhimpalashri or whatever).
All the same, some of those F0 histograms seem to have very clear multi-modal structure. This is entirely consistent with a view of pitch scaling in which the relationships are not purely multiplicative -- there might indeed be a limited set of discrete favored pitch-classes, and/or a set of favored "intervals" in some extended sense, e.g. in ratios of baseline-units above a baseline. But free pitch-range variation, general down-drift and various other phenomena ought to produce pretty smooth F0 histograms most of the time. If that doesn't happen, it would be nice to know why. And looking at F0 histograms (allowing for the manifold problems of pitch tracking errors, segmental effects, etc.) is an interesting idea about how to look for patterns in the melodies of speech, without imposing any particular assumptions about which parts of the contour matter and which don't. Dipole statistics might be even more interesting.
[Update: more here]
Posted by Mark Liberman at October 9, 2006 06:01 AM