April 27, 2007
Contingency-table literacy: no biomedical researcher left behind?
According to Anne Underwood, "It's Almost Too Good for Us to Believe", Newsweek, 4/26/2007
Prostate cancer is the second leading cancer killer among men, after lung cancer. The American Cancer Society projects that in 2007 there will be 219,000 new cases and 27,000 deaths. Yet detecting the disease early has always been problematic. The only blood test available now—a test for prostate-specific antigen (PSA)—is not good at distinguishing malignancies from benign prostate enlargement (BPH). And it's useless for separating aggressive cancers from others that are so slow-growing they will likely never cause problems.
But a new blood test, described this week in the journal Urology, could change all that. In a study of 385 men, the new test was able to distinguish BPH from prostate cancer, and it pinpointed men who were healthy, even when their PSA levels were higher than normal. It also did the reverse—singling out men with cancer, even when their PSA levels were low. It may also distinguish cancer confined to the prostate from cancer that has spread beyond the gland. And it has the potential to dramatically reduce the number of biopsies performed every year.
The body of this Newsweek article is an interview with Dr. Robert Getzenberg, the head of the lab at Johns Hopkins where the test was developed. As a guy entering the prostate-cancer time of life, I'm glad to see diagnostic progress. But as a teacher of pattern-classification algorithms, I was less happy to see a spectacular scientific misstatement in the interview as published:
How reliable is the test? Did you get any false positives?
About 3 percent of the time, when the test was positive, there was no prostate cancer there.
This was too good for me to believe. So I checked, and from Table 2 of the paper (Eddy S. Leman et al., "EPCA-2: A Highly Specific Serum Marker for Prostate Cancer", Urology 69(4), April 2007, Pages 714-720), I learned that the result was actually this: among 232 control samples from people without prostate cancer, 7 (or about 3%) tested positive. So a better way to answer the question would have been: "About 3 percent of the time, when there was no prostate cancer there, the test was positive".
Is this just a quibble, or does it matter? Well, a reasonable conclusion from Dr. Getzenberg's statement would be that a positive result from his group's test means that you have prostate cancer, 97 times out of 100. But as we'll see below, the true probability that you have prostate cancer given a positive test result (and assuming that the test's specificity really is 97%) is something more like 1.5%. (Given the 92% specificity actually claimed by the published paper, it would be about 0.6%).
The reason for that spectacular difference -- not 97%, but 1.5% or 0.6% or thereabouts -- is that the great majority of men don't have prostate cancer . Therefore, even a small false-positive rate will produce many more false positives than true positives. So a brutally honest answer to the interviewer's question might have been: "If our results hold up in larger trials, we anticipate that about 1.5% of men who test positive would actually have prostate cancer."
I guess it's possible that Dr. Getzenberg lost track of this elementary statistical point. It's also conceivable that Newsweek garbled his interview transcript. I'd hate to think that Dr. Getzenberg misspoke on purpose, influenced by the fact that "Johns Hopkins Hospital is working with Onconome Inc., a biomedical company based in Seattle, to bring the test to market within the next 18 months" ("Test improves prostate cancer diagnosis", Science Daily, 4/26/2007), and the royalties from a test that might be given every year to every man over 40 in the developed world would be stupendous.
Why was the published false positive rate really 8% rather than 3%?. Leman et al. (Table 2) give two different numbers for the "specificity in selected population[s]" of the new test. ["Specificity" is defined as TrueNegatives / (FalsePositives + TrueNegatives) -- if there are no false positives, then the specificity is 100%.]
The second of these "selected populations" is the set I just cited -- 232 people without prostate cancer, among whom there were 7 false positives, for a specificity of 225/232 = .9698. This set is described as "control groups that included normal women, as well as various benign and cancer serum samples". It's a bit odd to calculate the specifity of a prostate-cancer test on a sample including women, who don't have a prostate to start with. And so for a comparison to the traditional PSA test for prostate cancer, the "selected population" was different -- 98 men without prostate cancer, among whom there were 8 false positives, for a specificity of 90/98 = .9183.
This was still a lot better than the results of the PSA test, which gave 34 false positives in the same sample, for a specificity of 64/98 = .6531. But 92% isn't 97%, and 92% is the number that Dr. Getzenberg's group gives in the Urology paper:
Using a cutoff of 30 ng/mL, the EPCA-2.22 assay had a 92% specificity (95% confidence interval 85% to 96%) for healthy men and men with benign prostatic hyperplasia and 94% sensitivity (95% confidence interval [CI] 93% to 99%) for overall prostate cancer. The specificity for PSA in these selected groups of patients was 65% (95% CI 55% to 75%).
What's much more important is that the specificity (whether it's 97% or 92% or whatever) can be a very misleading number. It's the proportion of people without the disease who get a negative test result. But if you get a positive test result from your doctor, what you really want to know is the "positive predictive value", i.e. the proportion of people with positive test results who really have the disease. In this case, 97% specificity probably translates to a positive predictive value of 1.5%, whereas 92% specificity translates to a positive predictive value of about 0.58%.
In order to think about such things, people need to learn to analyze contingency tables. If I could wave a magic wand and change one thing about the American educational system, it might be this one.
Here's an example of a 2x2 contingency table for binary classification (adapted from the wikipedia article on "sensitivity"), set up to interpret the results of a medical test:
| The Truth | ||||
| Disease | No Disease | |||
| The Test Outcome |
Positive | True Positive | False Positive (Type I error) |
→ TP/(TP+FP) Positive predictive value |
| Negative | False Negative (Type II error) |
True Negative | → TN/(FN+TN) Negative predictive value |
|
| ↓ TP/(TP+FN) Sensitivity |
↓ TN/(FP+TN) Specificity |
|||
In filling out a table like this, it's not enough to know what the test does on selected samples -- we need to know what the overall frequency of the condition in the population is. Leman et al. dealt with a test sample of 100 men with prostate cancer, and two control samples without prostate cancer: one of 232 men and women, and another of 98 men. But those sample sizes were chosen for their convenience, to include roughly equal numbers of positive and negative instances. What would the numbers look like in a random sample of men?
I'm not sure, but these plots from M. Quinn and P. Babb, "Patterns and trends in prostate cancer incidence, survival, prevalence and mortality. Part I: international comparisons", BJU International, 90 (2002), 162-174, suggests that the rate of prostate cancer is somewhere between 50 and 100 per 100,000:
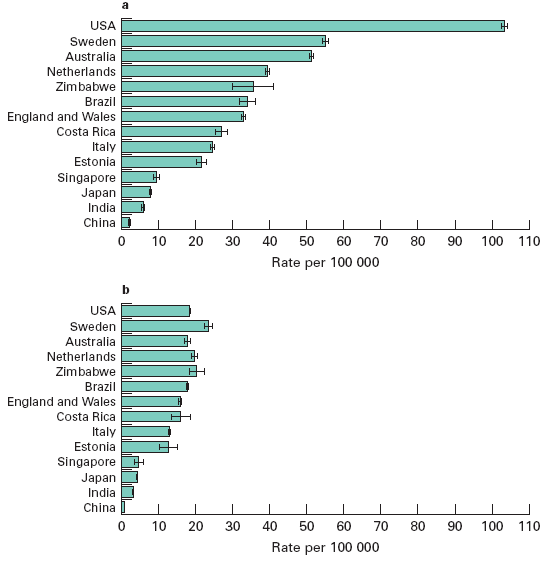
[Plot a is prostate cancer incidence, and plot b is prostate cancer mortality, both "age-standardized using the World standard population". I assume that the large difference in incidence between the U.S. and the next three countries, with much smaller differences in mortality, suggests that either the U.S. over-diagnoses, or Sweden, Australia and the Netherlands under-diagnose, or both.]
Remembering that "sensitivity" is the proportion of the genuine disease cases that the test correctly identifies as positive, i.e. the ratio of true positives to the sum of true positives and false negatives; and "specificity" is the proportion of disease-free people that the test correctly identifies as negative, i.e. the ratio of true negatives to the sum of true negatives and false positives; then:
Given a disease rate of 50 per 100,000, and a test with sensitivity of 94% and specificity of 92%, out of a random sample of 100,000 men, we'll have
Men with the disease = TruePositives + FalseNegatives = 50
Men without the disease = TrueNegatives + FalsePositives = 99,950Sensitivity = TP/(TP+FN) = 0.94, so TP = 0.94*50 = 47
Specificity = TN/(FP+TN) = 0.92, so TN = 0.92*99,950 = 91,954FN = 50-47 = 3
FP = 99,950 - 91,954 = 7,996
Now we can fill the table out with counts and percentages:
| The Truth | ||||
| Disease | No Disease | |||
| The Test Outcome |
Positive | True Positive n=47 |
False Positive (Type I error) n=7,996 |
→ TP/(TP+FP) Positive predictive value =0.58% |
| Negative | False Negative (Type II error) n=3 |
True Negative n=91,954 |
→ TN/(FN+TN) Negative predictive value =99.99+% |
|
| ↓ TP/(TP+FN) Sensitivity=94% |
↓ TN/(FP+TN) Specificity=92% |
|||
Given these assumptions, if you get a positive test result, the probability that you actually have cancer (the "positive predictive value") is 47/(47+7996), or 0.005843591 , or a bit less than 6 chances in 1,000. If the background rate is 50 per 100,000, the fact that you're now at 584 chances per 100,000 is worth worrying about -- your odds are more than 10 times worse -- but it's not as bad as 92,000 or 97,000 chances per 100,000.
If you get a negative test result, the probability that you don't actually have cancer is 91954/(91954+3), or 0.9999674. That's comforting, but if you don't take the test at all, your chances of being cancer-free are 99950/100000 =0.9995.
(You can redo the analysis for yourself, assuming other population rates for the disease. For example, if the incidence is 100 per 100,000, then the positive predictive value of the test would be .94*100/(.94*100+.08*99900), or about 1.2%.)
Similar analyses of the similar contingency tables are come up in information retrieval (where "precision" is used in place of "positive predictive value", and "recall" is used in place of "sensitivity"), in signal detection theory (see also the discussion of ROC curves and DET curves), and in general, in all branches of modern pattern recognition, AI, computational linguistics, and other fields where algorithmic classification is an issue.
Algorithmic classification is playing a bigger and bigger role in our lives -- and medical tests, though important, are only part of the picture.There's spam detection. There's biometric identification, both for identity verification and in forensic or intelligence applications. There are those programs that flag suspicious financial transactions, or suspicious air travelers. There's the integration of "intelligent" safety features into cars and other machines. And many others.
Details aside, this process is essentially inevitable. It's driven by ubiquitous networked computers, cheap networked digital sensors, more and more storage of more and more digital data, and advances in -omic knowledge and analysis.
The science and technology behind algorithmic classification techniques are varied and complex, but in the end, interpreting the results always comes down to analyzing contingency tables. And some of the relevant mathematics can get complicated, but the basic analysis of error types and error rates doesn't require anything beyond 6th-grade math and a willingness to learn some jargon like "specificity". To make informed personal and political choices in the 21st century, you'll need at least that much.
It's pretty clear that the Newsweek editors aren't there yet, or they would have corrected this portion of the interview. If Dr. Getzenberg wasn't misquoted, his command of basic contingency-table concepts is also shaky. I can testify that this stuff is generally news to American undergraduates, and even to most graduate students entering programs in psychology, biology, linguistics and computer science.
I don't expect that any of our presidential candidates will make contingency-table literacy part of their campaign platform. But maybe they should.
[Fernando Pereira writes:
To add insult to injury, the bio community is divided on the meaning of the term "specificity". Biostats use the meaning you give, but in bioinformatics, especially in gene prediction, "specificity" = TP/(FP+TP)
In other words, exactly what others refer to as "precision" or "positive predictive value". All the more reason to be sure that readers are clear about what the proportions (and counts) in the contingency table are really like.]
Posted by Mark Liberman at April 27, 2007 03:15 PM