November 17, 2007
Do men and women use different parts of their natural pitch ranges?
In response to my earlier post on gender polarization in F0 ("How about the Germans?" 11/14/2007), Bob Ladd wrote:
I was delighted to see the Pride and Prejudice graph, because it shows very clearly the distinction that I talked about in my book as the difference between "level" and "span". Karen Savage has a wide span and Annie Coleman has a narrow span, but their level (defined as mean F0) is more or less identical.
But the more interesting thing that caught my eye was a small but clear difference between males and females in all the graphs you show. For the men, you have a function with gradually increasing slope as you move from one decile to the next higher one. Translating this into a histogram of F0 values, it means that the male distribution is quite skewed toward the bottom of the range. The females, however, tend to have a slightly more S-shaped function as you go from the lowest to highest decile - steeper at the extremes, and flatter in the middle.
What this seems to mean is that men are talking closer to the physiologically determined bottom of their range - baseline, if you like - whereas women are talking further above the baseline.
Bob has a good eye for trends in graphical data, as I've noted before, and so I decided to check his impression quantitatively.
One obvious number to look at would be the difference between the median pitch and the bottom of the pitch range, as a fraction of the pitch range as a whole. Since even the best pitch trackers make some octave errors, using the actual extreme values would an even worse idea than usual, and I decided to use the 10th and 90th percentiles of each speaker's F0 values as a proxy for his or her pitch range.
If we call the three percentiles involved P10, P50, and P90, this proxy for "pitch range utilization" is then (P50-P10)/(P90-P10).
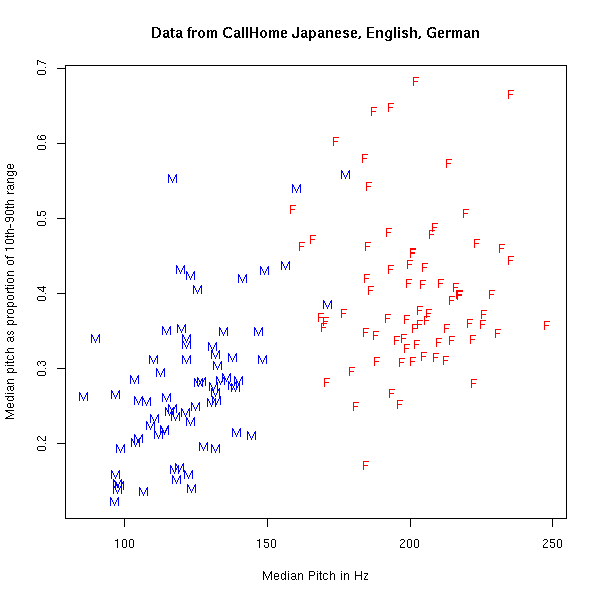
I had all the f0 estimates for the 150 speakers from my earlier post lying around, so these numbers just took a few minutes to calculate -- perhaps easiest Breakfast Experiment™ ever! I've plotted them below, on the vertical axis of a scatterplot whose horizontal axis is the median pitch.

For the females, the median pitch was on average at 0.4 of the span from the 10th percentile to the 90th percentile; for the males, the median pitch was on average at 0.28 of the 10%-90% span. So we can mark up another score for Bob's ability to see trends in graphs!
These measurements came from 75 telephone conversations in Japanese, English, and German, with a male speaker on one side and a female speaker on the other. See my earlier post for a bit more detail about the source of the digital audio, which is part of some speech corpora published by LDC in 1996 and 1997.)
Since there's O(100,000) pitch estimates per speaker, the individual data points are unlikely to be affected much by sampling error. On the other hand, there are very likely to be some systematic pitch-tracking problems in some of the files, for example because of background noise or channel distortion -- I took a look at a few of the pitch tracks to satisfy myself that things are working approximately as they should, but I didn't check systematically. (There may also be some issue with non-linear effects in some speakers' voices, leading to lots of period-doubling in low-pitched regions. It wouldn't surprise me to find that this was happening with some of the speakers with relatively high values on the y axis in the graph above.)
Note that there's relatively little overlap in the median pitch values -- pitch of the voice is one of the few secondary sexual characteristics where distributions for the sexes are almost completely separated. In contrast, there's quite a bit of overlap in the pitch-range-utilization statistic, despite the clear trend.
The most obvious explanation for the pitch-range-utilization effect is that males are choosing (perhaps unconsciously) to speak lower in their pitch range, and females are choosing to speak higher in their pitch range, in order to exaggerate the natural sex difference in the pitch of the voice. But there might be some anatomical and physiological reasons as well -- e.g. it takes more energy to stretch larger vocal cords, or the effects of a given increase in subglottal pressure are smaller for longer and more massive vocal cords. (Talk is cheap, metabolically speaking, so I would be inclined to discount those particular explanations, but there could well be some effects of that general kind.)
Posted by Mark Liberman at November 17, 2007 08:36 AM